This post was originally published on May 25th, 2007. It has been slightly modified from a previous version of the site.

One of the common threads of discussion in the financial community lately has been volatility – where it is now, where it has been, and where it might be soon.  Though yesterday’s events certainly caused a spike, the futures this morning seem to indicate that the VIX will likely drop again into the weekend.

Regardless of what will happen today, I wanted to cover which ETFs, either by asset choice or by asset management, are most affected by the VIX and what it represents.

Below are the twenty most and least correlated ETFs and CEFs to the VIX.

Twenty Most Negatively Volatility Correlated ETFs and CEFs

Symbol Corr
JSC -20.42%
MVV -19.76%
SSO -17.30%
DDM -16.28%
KRE -15.46%
JPP -14.79%
DXD -12.77%
SDS -12.76%
MZZ -12.37%
XPH -11.31%
KIE -10.17%
RPV -9.88%
CHI -9.71%
QTEC -9.67%
QID -9.54%
HCF -9.50%
DBC -9.48%
MUA -9.20%
PNI -9.16%
NZX -8.49%

Ten Most Positively Volatility Correlated ETFs and CEFs

Symbol Corr
PTH 10.61%
XRO 10.62%
DPD 10.66%
EGF 10.69%
PIC 11.36%
PIQ 11.36%
RYE 11.37%
FXA 11.74%
DEF 12.28%
PYZ 12.61%
PJB 12.84%
NFO 13.10%
CVY 13.18%
STH 13.79%
PSQ 14.27%
EEB 14.52%
PFI 14.91%
DOG 15.85%
MYY 16.52%
SH 18.64%

Strangely there are both long and short ETFs on the negatively correlated side.  JSC, MVV, SSO, and DDM are all common cap-specific S&P and Dow trackers.  DXD and SDS, however, two funds inverse on some of the exact same assets, are also in the list.

This suggests to me that the options and futures used to manage the leverage or inverse on these funds are too sensitive to volatility.  Though I would expect any reasonable fund manager to be able to partially vega hedge, it would seem to me that SDS nor DXD are far too vega-sensitive given that similar short funds are on the exact opposite side of the table.

On the positively correlated side, the top three ETFs are inverse on the cap-specific S&P and Dow indexes.  Interestingly, the financial and insurance ETFs and the Claymore BRIC EEB seem to be where money flows when the volatility increases, though it is important to note that regional banking as in the top negatively correlated assets.

As well as these, it’s also interesting to note the other funds that have done well.  Most seem to be related to dividends or currency, as the Australian dollar fund and the Zacks dividend yield hog are in the top 20.  It’s interesting to see that the Claymore Defense fund also see positive correlation here, but this is probably not causal but coincidental, given security shocks normally drive money to defense naturally.

It’s also nice to see DPD in there, as it is a Dow covered call fund.  This shows that the asset is well managed, as holding calls while volatility increases should be profitable.

In conclusion, though there are some surprising results that possibly indicate poor derivative management of inverse funds, the results can largely be used to hedge against volatility changes in non-derivative portfolios.
This post was originally published on May 21st, 2007.  It was imported from a previous version of the site.
As optionable securities, ETFs are providing traders with a dramatically safer means of profiting from sector momentum.  Though the AMEX and Philadelphia Exchange have listed index options for a number of years, the liquidity and rate of expansion of these derivatives was relatively varied.  Thus, many traders continued to rely on options for individual stocks within a sector as a proxy for the sector as a whole.

With the rapid expansion of ETFs and the competition between issuers and exchanges that has ensued, the number of sector and specialized index options has grown dramatically.  The following is a list of the top 30 ETFs on which options can be traded, ranked by volume.

ETF Name Symbol
SPDR TR UNIT SER 1 SPY
POWERSHARES QQQ TRUST UNIT SER 1 QQQQ
ISHARES TR RUSSELL 2000 IWM
SELECT SECTOR SPDR TR SBI INT-FINL XLF
SELECT SECTOR SPDR TR SBI INT-ENERGY XLE
ISHARES INC MSCI JAPAN EWJ
ISHARES INC MSCI MALAYSIA EWM
SEMICONDUCTOR HLDRS TR DEP RCPT SMH
OIL SVC HOLDRS TR DEPOSTRY RCPT OIH
ISHARES INC MSCI SINGAPORE EWS
ISHARES INC MSCI BRAZIL EWZ
DIAMONDS TR UNIT SER 1 DIA
ISHARES TR FTSE XNHUA IDX FXI
ISHARES TR MSCI EAFE IDX EFA
ISHARES INC MSCI AUSTRALIA EWA
ISHARES TR DJ US REAL EST IYR
POWERSHARES ETF TRUST AERSPC DEF PTF PPA
ISHARES INC MSCI GERMAN EWG
ISHARES INC MSCI HONG KONG EWH
ISHARES TR MSCI EMERG MKT EEM
ISHARES TR RUSL 2000 VALU IWN
SELECT SECTOR SPDR TR SBI INT-UTILS XLU
ISHARES TR RUSL 2000 GROW IWO
STREETTRACKS SER TR SPDR S&P RTL XRT
SELECT SECTOR SPDR TR SBI INT-INDS XLI
MIDCAP SPDR TR UNIT SER 1 MDY
RETAIL HOLDRS TR DEP RCPT RTH
ISHARES INC MSCI TAIWAN EWT
ISHARES TR S&P GSTI SEMIC IGW
VANGUARD INTL EQUITY INDEX FD EMR MKT ETF VWO


This post was originally published on May 16th, 2007. It has been slightly modified from a previous version of the site.

Dollar liquidity is simply the number of dollars traded on an asset (i.e. execution price times order size).  This property is an important measure of liquidity for asset managers who must determine where best to invest a fixed amount of capital.  Though many funds may represent attractive trends or  impressive returns, there simply are too few shares available at a given price at a given time to fully purchase your desired allocation.  This constraint can be mitigated by well-timed purchases or purchases in staggered lots, but this ignores the other end of the transaction – the sale.

Given the current anxiety level, this dollar liquidity is more important than ever.  Though stop loss orders are a great safety net, it would be dangerous to forget that market makers cannot always guarantee execution at the specified limit in all market conditions, especially given large order sizes.  The best way to reduce this risk is to invest in assets that have much higher levels of dollar liquidities.

The following is a list of all ETFs and CEFs that have traded at least 1 billion USD so far this year based on actual close and volume data.  All dollar figures are quoted in millions.

Symbol Day Week Month YTD Day $ Week $ Month $ YTD $ MA 20 Price MA YTD Price Week SPY Corr
SPY 0.03% -0.12% 2.37% 6.93% 27204 111129 332858 1257923 0.79% 4.60% 100.00%
QQQQ -0.77% -1.35% 2.08% 6.69% 8272 36484 102550 487329 -0.07% 3.71% 73.80%
IWM -0.80% -1.60% -1.53% 3.79% 9332 37811 108001 417929 -1.31% 1.49% 56.18%
OIH 0.17% 1.49% 5.60% 22.53% 1550 9742 32231 136593 3.15% 13.73% 68.39%
XLE 0.34% 0.96% 3.79% 16.07% 1051 7276 24952 128974 2.25% 10.24% 70.11%
DIA 0.30% 0.75% 5.08% 8.35% 2883 10188 30492 109297 2.13% 6.54% 64.87%
EEM 0.12% 0.76% 0.99% 8.43% 1140 6776 19461 97198 0.96% 7.09% 86.51%
QID 1.75% 2.46% -3.18% -9.85% 1190 4931 14153 47180 0.49% -5.70% -72.34%
EFA 0.18% 0.02% 0.65% 8.86% 513 3276 12239 45820 0.38% 5.37% 99.10%
XLF -0.24% -0.56% 2.52% 1.93% 616 3427 10244 42275 0.43% 2.55% 91.43%
MDY -0.37% -0.28% 1.34% 10.29% 686 3236 10931 42228 0.35% 4.76% 73.68%
SMH -1.26% 0.81% 8.77% 12.49% 602 2907 10705 41832 1.67% 8.20% 44.32%
GLD 0.39% -1.97% -2.15% 6.84% 171 1451 5385 31316 -1.31% 1.77% 65.50%
RTH -0.73% -1.36% -1.69% 2.49% 579 3042 8471 30825 -1.64% -0.11% 32.22%
EWZ 1.47% 2.17% 5.20% 19.96% 571 3016 7959 29952 3.53% 14.31% 73.20%
IYR -1.35% -1.14% -3.43% 1.18% 315 1536 5155 28462 -2.33% -3.23% 37.45%
EWJ -0.83% -0.62% -1.71% 1.27% 193 1988 5671 25135 -0.68% -0.83% 64.96%
FXI -0.34% 3.51% 1.89% -1.98% 297 2630 5575 21805 3.56% 8.14% 49.74%
USO 0.89% 0.72% -2.59% -0.83% 103 742 2878 17733 -1.38% -0.33% 10.57%
IVV -0.06% -0.15% 2.35% 6.43% 162 983 3289 17092 0.74% 4.26% 99.69%
IWO -0.78% -1.77% -1.37% 5.22% 146 887 3147 15665 -1.34% 2.06% 63.77%
XLB 0.63% 0.15% 2.51% 15.74% 143 1139 2865 15384 1.82% 6.75% 91.31%
EWW 0.15% 0.87% 2.51% 12.77% 169 1083 3394 15061 1.91% 8.56% 71.23%
XLU 0.54% 0.47% 3.52% 16.33% 217 846 2738 12869 1.38% 9.33% 64.34%
IWN -0.94% -1.77% -1.80% 2.41% 189 805 2538 12548 -1.34% 0.89% 56.79%
IMB -0.32% -0.25% 6.79% -28.70% 64 334 1358 9435 1.72% -6.54% 13.15%
XLI 0.26% 0.16% 4.87% 8.45% 114 567 1922 8507 1.74% 5.67% 89.77%
IBB -0.74% -3.55% -1.22% 2.42% 159 623 1801 8376 -2.83% 0.71% 64.06%
XHB -0.59% -1.63% 0.06% -7.17% 99 472 2095 8308 -2.06% -4.53% 62.56%
SDS 0.30% 0.94% -3.47% -8.92% 241 876 2567 8274 -0.84% -6.72% -95.79%
TLT -0.03% -0.80% 0.18% 0.25% 34 316 1229 7632 -0.31% 0.17% -20.81%
IWD 0.17% 0.14% 2.60% 7.31% 103 395 1381 7619 1.08% 4.92% 97.26%
QLD -1.44% -2.35% 3.67% 10.28% 125 639 1785 7408 -0.41% 5.94% 70.96%
IWF -0.36% -0.73% 1.59% 6.80% 67 422 1572 7355 0.22% 3.88% 86.99%
RKH 0.20% -0.75% 1.07% 0.69% 120 572 1851 7278 -0.21% 0.92% 70.92%
IJR -0.48% -1.24% -0.07% 6.45% 110 443 1768 6986 -0.56% 3.05% 59.78%
OEF -0.07% -0.23% 1.89% 4.66% 104 398 1801 6046 0.78% 3.95% 94.13%
EWT -0.28% -1.88% 0.00% -4.14% 45 389 1238 5966 -0.41% -0.39% 63.93%
XLV -0.11% -1.28% 0.81% 8.36% 83 356 1331 5942 -0.33% 4.63% 69.32%
IYT 0.09% -1.81% 1.01% 10.32% 41 416 1380 5756 -0.39% 3.86% 52.63%
SLV 0.56% -2.07% -5.17% 4.50% 30 267 1153 5518 -2.32% -1.58% 76.54%
XLY -0.36% -0.43% -0.74% 1.85% 128 420 1489 5342 -0.55% 0.63% 77.89%
PPH 0.05% -0.81% 1.08% 10.07% 30 358 1563 5195 0.28% 6.38% 85.58%
EWY -0.54% 0.36% 3.85% 14.00% 54 340 1062 5060 1.98% 9.60% 79.12%
ILF 0.51% 1.43% 3.31% 16.66% 58 350 1160 4847 2.15% 11.24% 63.57%
EWH -0.23% 0.77% 1.61% 5.26% 83 664 1133 4659 1.37% 3.62% 77.02%
EWS -0.81% 0.60% 1.67% 17.46% 68 268 992 4622 1.76% 9.19% 67.98%
XLK -0.16% -0.20% 3.69% 7.29% 86 416 979 4530 1.55% 5.31% 74.16%
ICF -1.48% -1.05% -4.39% -0.09% 45 205 610 4524 -2.85% -4.89% 49.95%
BBH -1.69% -4.84% -2.74% -2.45% 59 271 774 4504 -4.31% -3.64% 47.83%
SHY 0.02% -0.07% 0.24% 1.51% 76 302 1015 3985 0.02% 0.70% -47.42%
XLP 0.66% 0.07% -0.44% 4.28% 52 217 817 3820 -0.37% 2.33% 64.30%
EWM -0.41% 0.93% 2.21% 29.03% 56 265 819 3716 1.88% 12.45% 69.84%
KRE -0.63% -1.75% -1.36% -6.26% 9 310 1120 3390 -0.87% -2.74% 68.29%
AGG -0.04% -0.17% 0.19% 1.55% 27 151 628 3226 -0.04% 0.65% -64.75%
VWO 0.05% 0.68% 1.80% 9.50% 28 154 561 3060 1.30% 7.84% 90.38%
VTI -0.27% -0.55% 1.73% 6.89% 33 181 630 3036 0.39% 4.12% 93.20%
EPP -0.32% 0.77% 0.47% 15.21% 116 232 647 2909 1.09% 8.59% 67.42%
IWS -0.22% -0.19% 1.71% 9.22% 24 128 576 2754 0.46% 4.39% 88.27%
DXD -0.49% -1.27% -8.69% -11.13% 134 423 1170 2713 -3.74% -10.24% -68.88%
GDX -0.23% -4.12% -7.61% 1.67% 16 154 556 2626 -3.52% -1.36% 50.17%
DVY -0.01% -0.09% 2.03% 5.88% 54 164 543 2604 0.74% 4.23% 97.41%
IWV -0.16% -0.25% 1.91% 6.37% 43 169 475 2530 0.55% 3.97% 97.91%
IWB -0.16% -0.47% 2.10% 6.92% 16 83 352 2508 0.52% 4.26% 95.04%
XRT -0.64% -1.36% -4.29% 3.51% 37 333 691 2491 -2.86% -1.16% 31.50%
IVW -0.41% -0.74% 1.41% 5.33% 24 193 599 2467 0.20% 3.54% 88.35%
IEV 0.26% -0.04% 1.31% 9.61% 35 182 627 2383 0.44% 6.72% 96.95%
IWR -0.46% -0.59% 1.49% 9.08% 21 127 450 2379 0.15% 4.13% 82.44%
EWA -0.14% 1.01% 0.75% 19.20% 30 249 675 2308 1.29% 10.32% 66.88%
IVE 0.12% 0.21% 3.08% 7.00% 19 148 561 2274 1.15% 4.80% 95.88%
IJH -0.37% -0.29% 1.31% 9.62% 22 108 429 2212 0.31% 4.42% 68.44%
UTH 0.33% 0.78% 3.72% 19.10% 9 55 267 2200 1.61% 10.49% 68.13%
IFN -0.56% -0.39% -2.52% -10.30% 14 96 337 1885 -0.84% -2.14% 86.43%
IEF -0.01% -0.43% 0.27% 1.50% 14 83 432 1864 -0.12% 0.70% -36.23%
EZU 1.65% 0.61% 2.16% 12.53% 36 214 565 1852 1.12% 8.50% 82.06%
EWG 0.61% -0.03% 1.03% 15.62% 17 164 590 1824 0.28% 9.42% 97.07%
TIP -0.27% -0.70% -0.26% 1.12% 17 84 354 1751 -0.64% 0.18% -21.25%
SSO -0.27% -0.72% 4.01% 11.01% 32 162 477 1731 1.06% 7.66% 96.38%
VGK 0.24% -0.32% 1.02% 10.07% 19 127 404 1682 0.19% 6.49% 98.16%
KCE -1.25% -1.77% -1.69% 0.89% 115 204 524 1650 -1.44% -0.56% 49.16%
RSP -0.14% -0.47% 1.93% 8.56% 78 201 419 1647 0.36% 4.52% 90.81%
IWP -0.72% -0.90% 1.35% 9.12% 13 131 556 1591 -0.20% 3.89% 61.01%
KBE 0.02% -0.70% 1.18% -0.26% 12 65 381 1553 -0.22% 0.61% 71.56%
EZA -0.74% -2.33% -1.24% 16.55% 21 181 444 1530 -1.68% 8.65% 88.62%
LQD -0.22% -0.54% 0.25% 2.07% 19 75 326 1467 -0.20% 0.59% -5.06%
EWP 1.18% 1.53% -1.02% 7.88% 9 83 380 1380 0.91% 4.74% 71.23%
MZZ 0.91% 0.89% -1.78% -14.71% 18 86 251 1311 -0.31% -7.55% -83.60%
VNQ -1.52% -1.02% -4.01% 1.20% 33 65 194 1244 -2.47% -3.51% 53.74%
EWO 0.20% -0.08% -0.45% 9.10% 10 114 288 1211 -0.89% 5.54% 85.08%
IAI -1.24% -1.95% -1.75% 0.06% 5 71 229 1147 -1.56% -1.01% 65.67%
IYM 0.58% 0.61% 3.10% 18.25% 5 35 130 1126 2.15% 8.34% 91.00%
VUG -0.37% -0.82% 1.23% 6.57% 8 46 143 1102 0.05% 3.46% 88.15%
HHH -1.58% -3.17% 1.53% 13.86% 11 86 375 1095 0.84% 6.16% 49.61%
EWU 0.12% -0.55% -0.04% 6.75% 5 47 165 1062 0.27% 4.85% 97.86%
FXE 0.32% 0.36% 0.10% 3.74% 6 70 270 1034 -0.04% 2.62% 60.18%

This post was originally published on May 7th, 2007.  It has been republished from a previous version of the site.

Just in case the Dow continues to run, I’ve gone and generated the targets it has left if it intends to keep setting records.  Though this data is less useful than my analysis of the correlation between these percentages and subsequent return, it’s still important to get an idea what the market was doing the last time these records were set.

The following is a list from all the way from 10 sessions to 400 sessions.  The table should be pretty self-explanatory.  Most were in the mid 1950′s, followed by the early 1970′s.

Sessions Up Sessions Number of

Occasions

Last Date
10 10 20 Nov 14, 1996
11 11 9 Jan 2, 1992
12 12 4 Jan 19, 1987
13 13 1 Jan 19, 1987
14 13 28 Apr 19, 2007
15 14 16 Apr 19, 2007
16 15 7 Apr 19, 2007
17 16 3 Jul 5, 1929
18 17 2 Jul 5, 1929
19 18 1 Jul 5, 1929
20 18 4 Apr 26, 2007
21 19 1 Apr 26, 2007
22 19 18 May 4, 2007
23 20 11 May 4, 2007
24 21 7 May 4, 2007
25 22 4 May 4, 2007
26 23 2 May 4, 2007
27 24 1 May 4, 2007
28 24 6 May 4, 2007
29 25 2 Jul 5, 1955
30 26 1 Jul 5, 1955
31 26 7 Jul 8, 1955
32 27 5 Jul 8, 1955
33 28 3 Jul 8, 1955
34 29 1 Jul 5, 1955
35 29 5 May 4, 2007
36 30 2 Jul 8, 1955
37 31 1 Jul 8, 1955
38 31 3 May 4, 2007
39 31 12 May 4, 2007
40 32 7 May 4, 2007
41 33 3 May 4, 2007
42 34 1 May 4, 2007
43 34 5 May 4, 2007
44 35 3 May 4, 2007
45 36 1 Jul 26, 1955
46 36 5 Jul 27, 1955
47 37 3 Jul 26, 1955
48 38 2 Jul 26, 1955
49 39 1 Jul 26, 1955
50 39 2 Jul 27, 1955
51 39 4 Jul 28, 1955
52 40 1 Jul 26, 1955
53 40 5 Jan 29, 1971
54 41 1 Aug 2, 1955
55 41 5 Feb 5, 1971
56 42 1 Aug 4, 1955
57 42 16 Feb 12, 1971
58 43 8 Feb 12, 1971
59 44 4 Feb 12, 1971
60 45 2 Feb 12, 1971
61 45 11 Feb 16, 1971
62 46 6 Feb 12, 1971
63 47 3 Feb 12, 1971
64 48 1 Jan 29, 1971
65 48 4 Feb 2, 1971
66 49 2 Feb 2, 1971
67 49 7 Feb 5, 1971
68 50 3 Feb 5, 1971
69 51 1 Feb 5, 1971
70 51 8 Feb 12, 1971
71 52 5 Feb 12, 1971
72 53 3 Feb 12, 1971
73 54 2 Feb 12, 1971
74 55 1 Feb 12, 1971
75 55 3 Feb 16, 1971
76 56 1 Feb 12, 1971
77 56 3 Feb 16, 1971
78 56 9 Mar 8, 1971
79 57 2 Feb 12, 1971
80 57 12 Mar 15, 1971
81 58 4 Feb 24, 1971
82 59 1 Feb 12, 1971
83 59 7 Mar 15, 1971
84 60 1 Mar 1, 1971
85 60 12 Mar 17, 1971
86 61 7 Mar 8, 1971
87 62 3 Mar 8, 1971
88 63 2 Mar 8, 1971
89 64 1 Mar 8, 1971
90 64 4 Mar 10, 1971
91 65 2 Mar 10, 1971
92 65 6 Mar 15, 1971
93 66 3 Mar 15, 1971
94 67 1 Mar 15, 1971
95 67 4 Mar 17, 1971
96 68 2 Mar 17, 1971
97 68 5 Mar 18, 1971
98 69 1 Mar 17, 1971
99 69 4 Mar 18, 1971
100 69 10 Mar 19, 1971
101 70 4 Mar 17, 1971
102 71 1 Mar 15, 1971
103 71 6 Apr 16, 1971
104 72 1 Mar 17, 1971
105 72 10 Apr 16, 1971
106 73 4 Apr 16, 1971
107 74 1 Sep 2, 1955
108 74 4 Mar 17, 1971
109 75 1 Sep 2, 1955
110 75 8 Sep 6, 1955
111 76 3 Sep 27, 1954
112 77 1 Aug 3, 1954
113 77 9 Apr 16, 1971
114 78 4 Apr 16, 1971
115 79 3 Apr 16, 1971
116 80 2 Apr 16, 1971
117 81 1 Apr 16, 1971
118 81 4 Apr 19, 1971
119 82 1 Apr 16, 1971
120 82 4 Apr 19, 1971
121 83 1 Jul 8, 1955
122 83 5 Apr 16, 1971
123 83 27 Apr 27, 1971
124 84 12 Apr 27, 1971
125 85 7 Apr 16, 1971
126 86 4 Sep 27, 1954
127 87 3 Sep 27, 1954
128 88 2 Sep 27, 1954
129 89 1 Sep 27, 1954
130 89 2 Sep 28, 1954
131 89 6 Jul 26, 1955
132 90 2 Jul 26, 1955
133 91 1 Jul 26, 1955
134 91 7 Jul 27, 1955
135 92 3 Oct 5, 1954
136 93 1 Sep 27, 1954
137 93 2 Sep 28, 1954
138 93 4 Aug 2, 1955
139 93 16 Dec 2, 1955
140 94 8 Aug 4, 1955
141 95 4 Oct 5, 1954
142 96 2 Oct 5, 1954
143 96 7 Oct 6, 1954
144 97 2 Sep 27, 1954
145 98 1 Sep 27, 1954
146 98 6 Sep 28, 1954
147 99 4 Sep 27, 1954
148 100 3 Sep 27, 1954
149 101 2 Sep 27, 1954
150 102 1 Sep 27, 1954
151 102 2 Sep 28, 1954
152 102 3 Sep 29, 1954
153 102 9 Oct 5, 1954
154 103 5 Oct 5, 1954
155 104 3 Oct 5, 1954
156 105 1 Oct 5, 1954
157 105 2 Oct 6, 1954
158 105 8 Sep 2, 1955
159 106 3 Sep 2, 1955
160 107 2 Sep 2, 1955
161 108 1 Sep 2, 1955
162 108 2 Sep 6, 1955
163 108 3 Sep 7, 1955
164 108 8 Sep 13, 1955
165 109 3 Sep 13, 1955
166 110 2 Sep 13, 1955
167 111 1 Sep 13, 1955
168 111 4 Sep 16, 1955
169 112 2 Sep 16, 1955
170 113 1 Sep 16, 1955
171 113 5 Sep 20, 1955
172 114 1 Sep 20, 1955
173 114 5 Sep 22, 1955
174 115 2 Sep 22, 1955
175 115 9 Sep 27, 1955
176 116 4 Sep 27, 1955
177 117 2 Sep 27, 1955
178 117 6 Sep 28, 1955
179 117 20 Mar 12, 1959
180 118 6 Mar 12, 1959
181 119 3 Jul 26, 1955
182 120 1 Jul 26, 1955
183 120 7 Jul 27, 1955
184 121 4 Jul 26, 1955
185 122 2 Jul 26, 1955
186 123 1 Jul 26, 1955
187 123 2 Jul 27, 1955
188 123 3 Jul 28, 1955
189 123 16 Mar 12, 1959
190 124 6 Aug 2, 1955
191 125 3 Aug 2, 1955
192 126 1 Nov 26, 1954
193 126 4 Aug 4, 1955
194 126 17 Aug 11, 1955
195 127 7 Jul 26, 1955
196 128 4 Jul 26, 1955
197 129 2 Dec 6, 1954
198 130 1 Dec 6, 1954
199 130 2 Dec 7, 1954
200 130 3 Dec 8, 1954
201 130 10 Sep 2, 1955
202 131 3 Dec 31, 1954
203 132 1 Dec 6, 1954
204 132 6 Nov 7, 1955
205 133 2 Nov 7, 1955
206 134 1 Nov 7, 1955
207 134 12 Nov 15, 1955
208 135 8 Nov 15, 1955
209 136 5 Nov 15, 1955
210 137 3 Nov 15, 1955
211 138 1 Nov 15, 1955
212 138 5 Nov 16, 1955
213 139 2 Sep 2, 1955
214 140 1 Sep 2, 1955
215 140 2 Sep 6, 1955
216 140 9 Nov 23, 1955
217 141 1 Nov 23, 1955
218 141 9 Nov 29, 1955
219 142 5 Nov 29, 1955
220 143 2 Nov 29, 1955
221 143 9 Dec 2, 1955
222 144 4 Dec 2, 1955
223 145 2 Dec 2, 1955
224 145 6 Dec 5, 1955
225 146 1 Sep 20, 1955
226 146 8 Dec 7, 1955
227 147 3 Sep 22, 1955
228 148 1 Jul 26, 1955
229 148 4 Sep 27, 1955
230 149 1 Sep 27, 1955
231 149 3 Sep 28, 1955
232 149 10 Sep 29, 1955
233 150 2 Sep 16, 1955
234 150 13 Nov 15, 1955
235 151 6 Oct 4, 1955
236 152 2 Jan 31, 1955
237 153 1 Jan 31, 1955
238 153 3 Mar 3, 1955
239 153 11 Sep 27, 1955
240 154 3 Sep 27, 1955
241 154 15 Dec 29, 1955
242 155 4 Jul 8, 1955
243 156 1 Jul 5, 1955
244 156 9 Jul 26, 1955
245 157 4 Jul 8, 1955
246 158 1 Jul 8, 1955
247 158 3 Jul 11, 1955
248 158 11 Oct 21, 1955
249 159 4 Jul 14, 1955
250 160 2 Jul 14, 1955
251 160 18 Nov 15, 1955
252 161 9 Sep 2, 1955
253 162 6 Sep 2, 1955
254 163 4 Sep 2, 1955
255 164 2 Sep 2, 1955
256 165 1 Sep 2, 1955
257 165 4 Sep 6, 1955
258 166 1 Jul 26, 1955
259 166 7 Nov 15, 1955
260 167 1 Nov 15, 1955
261 167 7 Nov 16, 1955
262 168 4 Nov 15, 1955
263 169 2 Nov 15, 1955
264 170 1 Nov 15, 1955
265 170 5 Nov 16, 1955
266 170 20 Nov 23, 1955
267 171 10 Sep 20, 1955
268 172 6 Jul 8, 1955
269 173 3 Jul 5, 1955
270 174 2 Jul 5, 1955
271 175 1 Jul 5, 1955
272 175 4 Jul 8, 1955
273 176 2 Jul 8, 1955
274 177 1 Jul 8, 1955
275 177 2 Jul 11, 1955
276 177 8 Dec 2, 1955
277 178 3 Jul 14, 1955
278 179 1 Jul 14, 1955
279 179 6 Jul 26, 1955
280 180 1 Jul 26, 1955
281 180 11 Jul 27, 1955
282 181 6 Jul 26, 1955
283 182 4 Jul 26, 1955
284 183 3 Jul 26, 1955
285 184 2 Jul 26, 1955
286 185 1 Jul 26, 1955
287 185 2 Jul 27, 1955
288 185 4 Jul 28, 1955
289 186 1 Jul 26, 1955
290 186 5 Aug 2, 1955
291 187 2 Aug 2, 1955
292 187 8 Aug 4, 1955
293 188 3 Aug 4, 1955
294 189 1 Jul 26, 1955
295 189 5 Jul 27, 1955
296 190 1 Jul 26, 1955
297 190 14 Aug 11, 1955
298 191 8 Aug 11, 1955
299 192 4 Jul 5, 1955
300 193 2 Jul 5, 1955
301 194 1 Jul 5, 1955
302 194 7 Jul 8, 1955
303 195 5 Jul 8, 1955
304 196 3 Jul 8, 1955
305 197 1 Jul 5, 1955
306 197 5 Jul 8, 1955
307 198 3 Jul 8, 1955
308 199 1 Jul 8, 1955
309 199 5 Jul 11, 1955
310 200 2 Jul 8, 1955
311 200 7 Jul 14, 1955
312 201 3 Jul 14, 1955
313 202 1 Jul 8, 1955
314 202 13 Sep 2, 1955
315 203 6 Jul 26, 1955
316 204 3 Jul 26, 1955
317 205 1 Jun 24, 1955
318 205 11 Jul 26, 1955
319 206 7 Jul 26, 1955
320 207 5 Jul 26, 1955
321 208 3 Jul 5, 1955
322 209 2 Jul 5, 1955
323 210 1 Jul 5, 1955
324 210 4 Jul 8, 1955
325 211 2 Jul 8, 1955
326 212 1 Jul 8, 1955
327 212 2 Jul 11, 1955
328 212 8 Jul 14, 1955
329 213 4 Jul 14, 1955
330 214 2 Jul 14, 1955
331 214 6 Jul 15, 1955
332 215 2 Jul 8, 1955
333 216 1 Jul 8, 1955
334 216 7 Jul 26, 1955
335 217 4 Jul 26, 1955
336 218 3 Jul 26, 1955
337 219 2 Jul 26, 1955
338 220 1 Jul 26, 1955
339 220 2 Jul 27, 1955
340 220 3 Jul 28, 1955
341 220 16 Aug 2, 1955
342 221 10 Aug 2, 1955
343 222 6 Aug 2, 1955
344 223 3 Jul 26, 1955
345 224 1 Jul 26, 1955
346 224 4 Jul 27, 1955
347 225 1 Jul 8, 1955
348 225 2 Jul 11, 1955
349 225 13 Aug 11, 1955
350 226 6 Aug 11, 1955
351 227 2 Jul 26, 1955
352 227 8 Aug 4, 1955
353 228 2 Jul 26, 1955
354 229 1 Jul 26, 1955
355 229 6 Jul 27, 1955
356 230 4 Jul 26, 1955
357 231 3 Jul 26, 1955
358 232 2 Jul 26, 1955
359 233 1 Jul 26, 1955
360 233 2 Jul 27, 1955
361 233 3 Jul 28, 1955
362 233 13 Sep 2, 1955
363 234 8 Sep 2, 1955
364 235 5 Sep 2, 1955
365 236 2 Sep 2, 1955
366 237 1 Sep 2, 1955
367 237 2 Sep 6, 1955
368 237 3 Sep 7, 1955
369 237 15 Sep 13, 1955
370 238 9 Sep 13, 1955
371 239 6 Sep 13, 1955
372 240 3 Sep 13, 1955
373 241 1 Sep 2, 1955
374 241 4 Sep 16, 1955
375 242 1 Sep 16, 1955
376 242 3 Sep 20, 1955
377 243 1 Sep 20, 1955
378 243 7 Sep 22, 1955
379 244 3 Sep 22, 1955
380 244 12 Sep 27, 1955
381 245 6 Sep 27, 1955
382 246 3 Sep 27, 1955
383 246 11 Sep 28, 1955
384 247 5 Sep 20, 1955
385 248 3 Sep 2, 1955
386 249 2 Sep 2, 1955
387 250 1 Sep 2, 1955
388 250 2 Sep 6, 1955
389 250 4 Sep 27, 1955
390 250 15 Sep 28, 1955
391 251 6 Sep 16, 1955
392 252 3 Sep 13, 1955
393 253 1 Sep 13, 1955
394 253 4 Sep 16, 1955
395 254 2 Sep 16, 1955
396 255 1 Sep 16, 1955
397 255 3 Sep 20, 1955
398 256 1 Sep 20, 1955
399 256 3 Sep 22, 1955
400 257 1 Sep 22, 1955

This post was originally published on April 13th, 2008. It was imported from a previous version of the site.

The simple moving average is easily the most fundamental indicator in technical analysis, and though there are many ways to use it, Tom Lydon of ETF Trends gives an example here.  I wanted to go into some detail on the relationship between the moving average and its predictive power, as I’ve done some comprehensive analysis of similar strategies in the currency markets.  Following along with Tom, I’ve decided to use the SPY tracker ETF for this example.

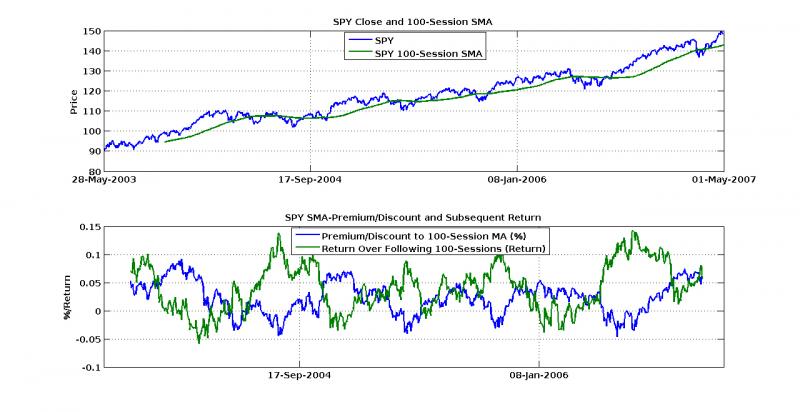
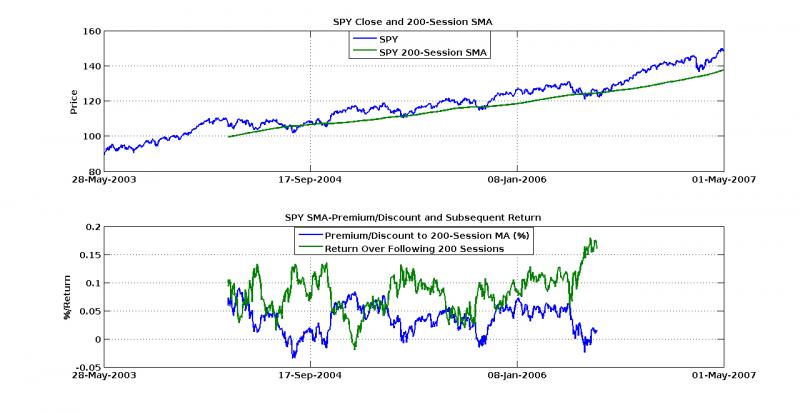
What I’ve done here is something similar to premium/discount analysis.  Pretend that the moving average is some underlying valuation, and look at what percentage above or below that price the ETF is actually trading.  You can see the actual close price and the moving average calculated on it in the top panel.  In the bottom panel, you’ll see the percentage of premium discount (in decimal form, e.g. 0.05 = 5%), as well as the cumulative return over the next N sessions.

To give some comparable horizon, I fixed the return outlook to the exact length of the moving average.  That is, if the premium/discount is calculated over the moving average of the last 100 sessions, I look at the return over the next 100 days.  Though this fails to take into account stop-loss strategies or other trailing/bracketed order methods, it gives a better picture of how the premium/discount factor and the actual market are correlated.  Furthermore, though discipline in your loss minimization is an absolute must, it makes much more sense to invest when the trend is more in your favor, both for actual performance and tax purposes.

So here are these calculations for both 100- and 200-sessions.  Note that the bottom panel of each graph only shows regions over which the numbers make sense, that is, once the moving average can be calculated and while there is still a full return period remaining.

For both graphs, the results look surprisingly symmetric.  When the premium is high, returns are low, and if the SPY is actually trading at a discount to its moving average, buy-buy-buy!  Accumulating when at or below the moving average seems to be a much better strategy for longer term holds.  For example, on the 200-session moving average, buying blocks when the SPY traded near par and selling them dumbly after 200 days, you’d make a little over 10% on average.  Following a similar strategy for the 100-session and buying blocks at about 3% discount yields even higher average returns!

There are a few important things to note though.  First, this does not beat a vanilla buy-and-hold forever strategy for return, but it does reduce the value at risk.  For most portfolios, one trumps the other!  Secondly, this strategy is only shown here when the derivative of the 200-session moving average is positive, that is, when the 200-session trend line is increasing.  This strategy is much more profitable when the 200-session moving average is not downward sloping, and I think this is where Tom’s wisdom comes from.  Though you might miss the initial rally that leads the moving average into a positive trend, you also miss all the times it doesn’t.

Though you can’t backtest the future, and index trackers are far different beasts than specialized ETFs, this data seems to point to a dumb yet successful strategy similar to premium strategies that bond and mutual fund traders often employ.  Though no replacement for disciplined loss management, it does seem to warrant further attention across the broader range of ETF products.