Abstract: Given that both S&P 500 index and VIX options essentially contain information on the future dynamics of the S&P 500 index, in this study, we set out to empirically investigate the informational roles played by these two option markets with regard to the prediction of returns, volatility and density in the S&P 500 index. Our results reveal that the information content implied from these two option markets is not identical. In addition to the information extracted from the S&P 500 index options, all of the predictions for the S&P 500 index are significantly improved by the information recovered from the VIX options. Our findings are robust to various measures of realized volatility and methods of density evaluation.

C. San-Lin, W.-C. Tsai, Y.-H. Wang, P.-S. P. Weng. The Information Content of the S&P 500 Index and VIX Options on the Dynamics of the S&P 500 Index. http://ssrn.com/abstract=1711036.
Here’s a paper out of the CabDyn group at Oxford from D. Fenn and M. Porter. Mason is also one of the leading researchers in network science, and their group has entered into a number of joint Ph.D./post-doctoral hires with the business school there. The result is a large number of interesting papers.  This particular paper investigates correlation matrices through RMT, which is exactly what my Quantitative Finance paper and recent working paper address.  Though they don’t examine their calculations in an applied context, the results provide additional view into recent correlation dynamics.  Abstract and download below:

Abstract: We investigate financial market correlations using random matrix theory and principal component analysis. We use random matrix theory to demonstrate that correlation matrices of asset price changes contain structure that is incompatible with uncorrelated random price changes. We then identify the principal components of these correlation matrices and demonstrate that a small number of components accounts for a large proportion of the variability of the markets that we consider. We then characterize the time-evolving relationships between the different assets by investigating the correlations between the asset price time series and principal components. Using this approach, we uncover notable changes that occurred in financial markets and identify the assets that were significantly affected by these changes. We show in particular that there was an increase in the strength of the relationships between several different markets following the 2007–2008 credit and liquidity crisis.

D. J. Fenn, M. A. Porter, S. Williams, M. McDonald, N. F. Johnson, N. S. Jones. Temporal Evolution of Financial Market Correlations. http://arxiv.org/abs/1011.3225.

I saw that this paper on SSRN, High Frequency Trading and its Impact on Market Quality, was updated a week or so ago (courtesy of Alea) and I thought it would be worth posting.   The abstract of the paper below:

This paper examines the impact of high frequency trading (HFT) on the U.S. equities market. I analyze a unique dataset to study the strategies utilized by high frequency traders (HFTs), their profitability, and their relationship with characteristics of the overall market, including liquidity, price discovery, and volatility. The 26 high frequency trading firms in the dataset participate in 73.7\% of all trades. I find the following key results: (1) HFTs tend to follow a price reversal strategy driven by order imbalances, (2) HFTs earn gross trading profits of approximately \$2.8 billion annually, (3) HFTs do not seem to systematically engage in a non-HFTr anticipatory trading strategy, (4) HFTs’ strategies are more correlated with each other than are non-HFTs’, (5) HFTs’ trading level changes only moderately as volatility increases, (6) HFTs add substantially to the price discovery process, (7) HFTs provide the best bid and offer quotes for a significant portion of the trading day and do so strategically so as to avoid informed traders, but provide only one-fourth of the book depth as do non-HFTs, and (8) HFTs may dampen intraday volatility. These findings suggest that HFTs’ activities are not detrimental to non-HFTs and that HFT tends to improve market quality.

J. Brogaard. High Frequency Trading and its Impact on Market Quality. Available at SSRN.

My gut instinct is that there are a few issues with the paper:

  • As Jonathan acknowledges, he does not address order book dynamics or, more importantly, other identified malicious HFT practices (e.g., stuffing).  Since this is a job paper and therefore has to be approachable and “bite-sized,” this in itself is fine.  However, the normative claim that “HFTs are not bad” may be too strong in the absence of this analysis.
  • Without a better idea of where HFTs trade, it is hard to extrapolate from the sample of 120 stocks.  The exact selection method is not explicit in the paper, but it seems that the stocks were chosen from the NASDAQ to include a range of market caps.  Without a better idea of where HFTs trade, it is quite possible that this selection undersamples the stocks that most HFT transactions occur on.  In the absence of industry-wide data, this is a necessary research choice, but its limiting nature on the conclusions should be better stated.
  • On a somewhat related note, the estimation of profitability and risk-adjusted return is quite daring given the above two constraints.

Despite these few notes, the paper should definitely get Jonathan a great job and I’m interested to see more work on his dataset.  He’s also got a great advisor, Thomas Brennan, who I met at the Midwest Law & Economics Conference.  Thomas has more industry experience than 90% of all academics and his papers also make for great reads (some on SSRN, most in law reviews or finance journals).

Here’s another new paper on q-FIN that I thought might be worth mentioning.  Having skimmed it, I have a few questions.  First, if the paper’s title includes the phrase “different time-scales,” you should include more than 15-minute interval sampling.  I’d like to see whether their conclusions are robust on two-minute or 60-minute intervals as well (like this).  Second, there is a large body of literature on the leading eigenvalues of the correlation matrix.  This path of inquiry is twenty years old and has already produced a number of the conclusions that are in the paper.  I guess I’m curious as to why they chose to use sum-of-signs instead of something like the proportion of the leading eigenvalue to the sum of eigenvalues (it works well here).   Anyway, even if there are some methodological issues, the paper’s conclusions are interesting and it’s always nice to see fresh work on intra-day dynamics and market “panic.”

Cross-sectional signatures of market panic were recently discussed on daily time scales in [1], extended here to a study of cross-sectional properties of stocks on intra-day time scales. We confirm specific intra-day patterns of dispersion and kurtosis, and find that the correlation across stocks increases in times of panic yielding a bimodal distribution for the sum of signs of returns. We also find that there is memory in correlations, decaying as a power law with exponent 0.05. During the Flash-Crash of May 6 2010, we find a drastic increase in dispersion in conjunction with increased correlations. However, the kurtosis decreases only slightly in contrast to findings on daily time-scales where kurtosis drops drastically in times of panic. Our study indicates that this difference in behavior is result of the origin of the panic-inducing volatility shock: the more correlated across stocks the shock is, the more the kurtosis will decrease; the more idiosyncratic the shock, the lesser this effect and kurtosis is positively correlated with dispersion. We also find that there is a leverage effect for correlations: negative returns tend to precede an increase in correlations. A stock price feed-back model with skew in conjunction with a correlation dynamics that follows market volatility explains our observations nicely.

L. Borland, Y. Hassid. Market panic on different time-scales. arXiv:1010.4917

Another week in the black for the market, though only barely for most indices. The list of big movers this week is an interesting one.

In the green, we have exchange-traded funds for cotton (BAL), 2x inverse Brazil (BZQ), coffee (JO), 3x real estate (DRN), and 2x inverse silver (ZSL).  Interestingly, cotton, Brazil, coffee, and silver are all commodity or export-based assets that are strongly affected by the dollar.  However, the direction of their movement varied (remember, ZSL is inverse silver).

The red side of the table features 3x inverse real estate (DRV), 2x BRICs (BRIL), 2x Brazil (UBR), natural gas (GAZ), and short-term VIX (VXX).  DRV, BRIL, and UBR all correspond to funds on the green side of the table.  However, the natural gas ETF (GAZ) and VIX ETF (VXX) do not have corresponding products in the green.

VXX especially has been labeled a “bad” product (see agwarner’s latest in his ongoing crusade against VXX).  I would tend to agree with Adam, as a number of VXX calls I recently held expired OTM despite what would have been a profitable trade on the underlying futures.

Symbol Return $ Volume
BAL 9.7% 15M
BZQ 9.4% 12M
JO 6.3% 7M
DRN 6.3% 284M
ZSL 6.3% 86M
DRV -7.5% 140M
BRIL -7.6% 1M
UBR -10.3% 4M
GAZ -11.2% 7M
VXX -12.7% 2.6B

Since we’re in for a few weeks driven by domestic data and possible market exogeneities (e.g., G-20, France, U.S. politics), look for these ETFs to continue their dramatic moves.

Here’s the beginning of an FT Alphaville article from this morning:

Whilst much has been written about the rise in correlation recently — what’s been less frequently observed is the strange disconnection that’s occurring between correlation and volatility.

The two traditionally move together. That is, correlation tends to rise and fall with volatility.

Yet as FT Alphaville discovered — whilst working on a special report on the subject of how increasing correlation is impacting banks’ structured products desks — what’s really puzzling at the moment is why correlation is refusing to budge lower as volatility has fallen.

Read the rest here – `Something exceptional’ is happening in volatility, correlation

Another paper of note on q-fin last night. Though this one isn't completely new, I thought it was worth noting since H. Eugene Stanley has received quite a bit of press with his "financial earthquake" research.

We study the cascading dynamics immediately before and immediately after 219 market shocks. We define the time of a market shock T_{c} to be the time for which the market volatility V(T_{c}) has a peak that exceeds a predetermined threshold. The cascade of high volatility "aftershocks" triggered by the "main shock" is quantitatively similar to earthquakes and solar flares, which have been described by three empirical laws — the Omori law, the productivity law, and the Bath law. We analyze the most traded 531 stocks in U.S. markets during the two-year period 2001-2002 at the 1-minute time resolution. We find quantitative relations between (i) the "main shock" magnitude M \equiv \log V(T_{c}) occurring at the time T_{c} of each of the 219 "volatility quakes" analyzed, and (ii) the parameters quantifying the decay of volatility aftershocks as well as the volatility preshocks. We also find that stocks with larger trading activity react more strongly and more quickly to market shocks than stocks with smaller trading activity. Our findings characterize the typical volatility response conditional on M, both at the market and the individual stock scale. We argue that there is potential utility in these three statistical quantitative relations with applications in option pricing and volatility trading.

Alexander M. Petersen, Fengzhong Wang, Shlomo Havlin, H. Eugene Stanley. Market dynamics immediately before and after financial shocks: quantifying the Omori, productivity and Bath laws. 82 Phys. Rev. E., forthcoming (2010). http://arxiv.org/abs/1006.1882

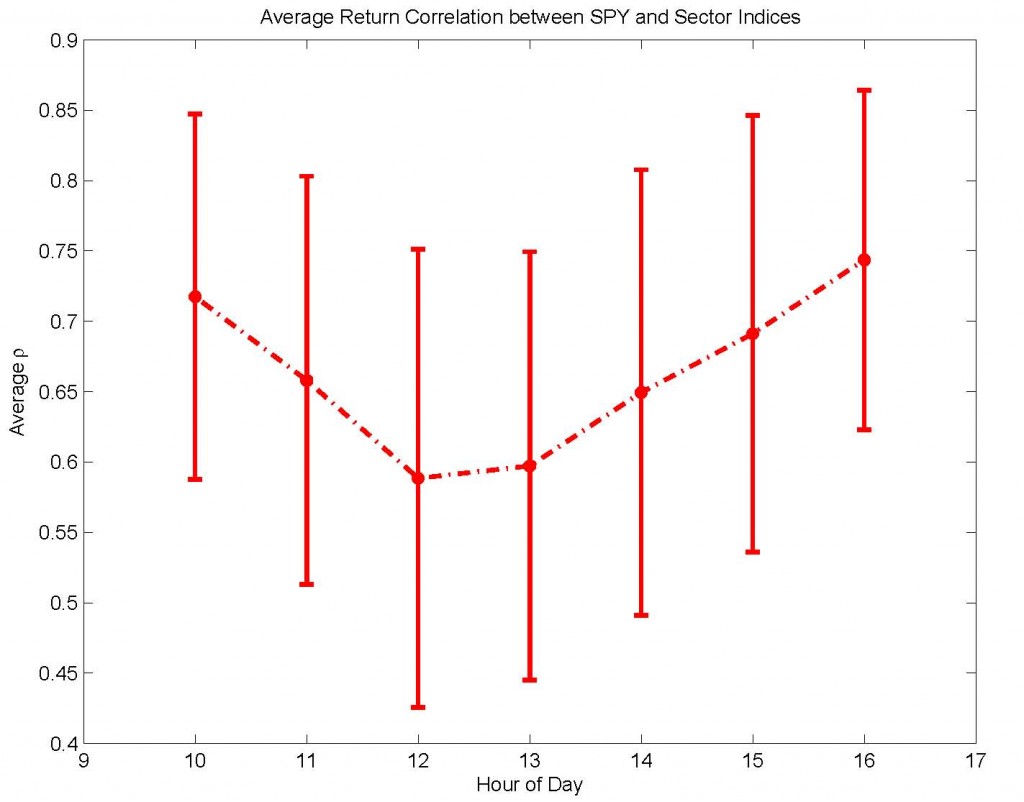
Kristina Peterson’s article in the WSJ last week on intraday patterns got me thinking and the result is this brief research paper.  There’s a significant amount of work I’d like to put into the paper, especially the preliminary analysis on volume correlation, but the results are interesting enough that I decided to publish a draft.  You can read the abstract below and download the paper here.

In this brief research note, I explore recent patterns in intraday return and volume correlation between the S\&P 500 and sector indices, as represented by minutely data from Aug. 23 to Sep. 10 for the SPDR exchange-traded funds. Notably, there appears to be evidence of two previously unreported patterns in intraday correlation. First, there is a “U-shaped” trend in return correlation, characterized by higher correlation at open and close and lower correlation during mid-day hours. Second, volume correlation is marked by lower values in the morning and increasing values in the afternoon. In some cases, this trend even takes the infamous “hockey-stick” shape, exhibiting stable values in the morning but sharply increasing values in the late afternoon. To ensure that these patterns are not a function of the choice of correlation window size, I confirm that these patterns are qualitatively stable over correlation windows ranging from 10 minutes to 90 minutes. These findings indicate that non-time-stationary patterns exist not only for volume and volatility, as previously reported, but also for the correlation of return and volume between the market and sector indices. These results have possible implications for intraday market efficiency and for trading strategies that rely on intraday time-stationarity of return or volume correlation.

Bommarito, Michael James, Intraday Correlation Patterns between the S&P 500 and Sector Indices (September 16, 2010). Available at SSRN: http://papers.ssrn.com/sol3/papers.cfm?abstract_id=1677915