Instead of posting papers separately, I’ve decided to transition to a weekly reading list format.  I’ll update this post over the course of the week, but here’s the initial list:

I received an email from Quantitative Finance informing me that my paper with A. Duran,
A Profitable Trading and Risk Management Strategy Despite Transaction Cost, will be freely available online in a “virtual issue” of the journal on risk. This issue is designed to coincide with the RiskMinds 2010 conference currently taking place. Please access the published version of my paper from InformaWorld here or the entire Risk issue here through the end of the month.

Abstract: Given that both S&P 500 index and VIX options essentially contain information on the future dynamics of the S&P 500 index, in this study, we set out to empirically investigate the informational roles played by these two option markets with regard to the prediction of returns, volatility and density in the S&P 500 index. Our results reveal that the information content implied from these two option markets is not identical. In addition to the information extracted from the S&P 500 index options, all of the predictions for the S&P 500 index are significantly improved by the information recovered from the VIX options. Our findings are robust to various measures of realized volatility and methods of density evaluation.

C. San-Lin, W.-C. Tsai, Y.-H. Wang, P.-S. P. Weng. The Information Content of the S&P 500 Index and VIX Options on the Dynamics of the S&P 500 Index. http://ssrn.com/abstract=1711036.

Tonight, I’ll be clearing out a backlog of papers built up over the last few days. Here’s the first paper (not including mine) – Network-Based Modeling and Analysis of Systemic Risks in Banking Systems.  The paper is interesting for two reasons.  First, they model a banking system with an explicit network of bank-to-bank relationships and correlated bank balance sheets.  Second, they simulate their model to compare the ability of  bank risk measures to predict contagion.  I’m not sure their LASER algorithm is actually any different than the Kleinberg HITS method applied to an edge-weighted network, but it does outperform the standard accounting measures in their simulations.  Abstract and download below:

Abstract: Preventing financial crisis has become the concerns of average citizens all over the world and the aspirations of academics from disciplines outside finance. In many ways, better management of financial risks can be achieved by more effective use of information in financial institutions. In this paper, we developed a network-based framework for modeling and analyzing systemic risks in banking systems by viewing the interactive relationships among banks as a financial network. Our research method integrates business intelligence (BI) and simulation techniques, leading to three main research contributions in this paper. First, by observing techniques such as the HITS algorithm used in estimating relative importance of web pages, we discover a network-based analytical principle called the Correlative Rank-In-Network Principle (CRINP), which can guide an analytical process for estimating relative importance of nodes in many types of networks beyond web pages. Second, based on the CRINP principle, we develop a novel risk estimation algorithm for understanding relative financial risks in a banking network called Link-Aware Systemic Estimation of Risks (LASER) for purposes of reducing systemic risks. To validate the LASER approach, we evaluate the merits of the LASER by comparing it with conventional approaches such as Capital Asset Ratio and Loan to Asset Ratio as well as simulating the effect of capital injection guided by the LASER algorithm. The simulation results show that LASER significantly outperforms the two conventional approaches in both predicting and preventing possible contagious bank failures. Third, we developed a novel method for effectively modeling one major source of bank systemic risk – correlated financial asset portfolios – as banking network links. Another innovative aspect of our research is the simulation of systemic risk scenarios is based on real-world data from Call Reports in the U.S. In those scenarios, we observe that the U.S. banking system can sustain mild simulated economic shocks until the magnitude of the shock reaches a threshold. We suggest our framework can provide researchers new methods and insights in developing theories about bank systemic risk. The BI algorithm – LASER, offers financial regulators and other stakeholders a set of effective tools for identifying systemic risk in the banking system and supporting decision making in systemic risk mitigation.

D. Hu, J. L. Zhao, Z. Hua, M. C. S. Wong. Network-Based Modeling and Analysis of Systemic Risks in Banking Systems. http://ssrn.com/abstract=1702467.

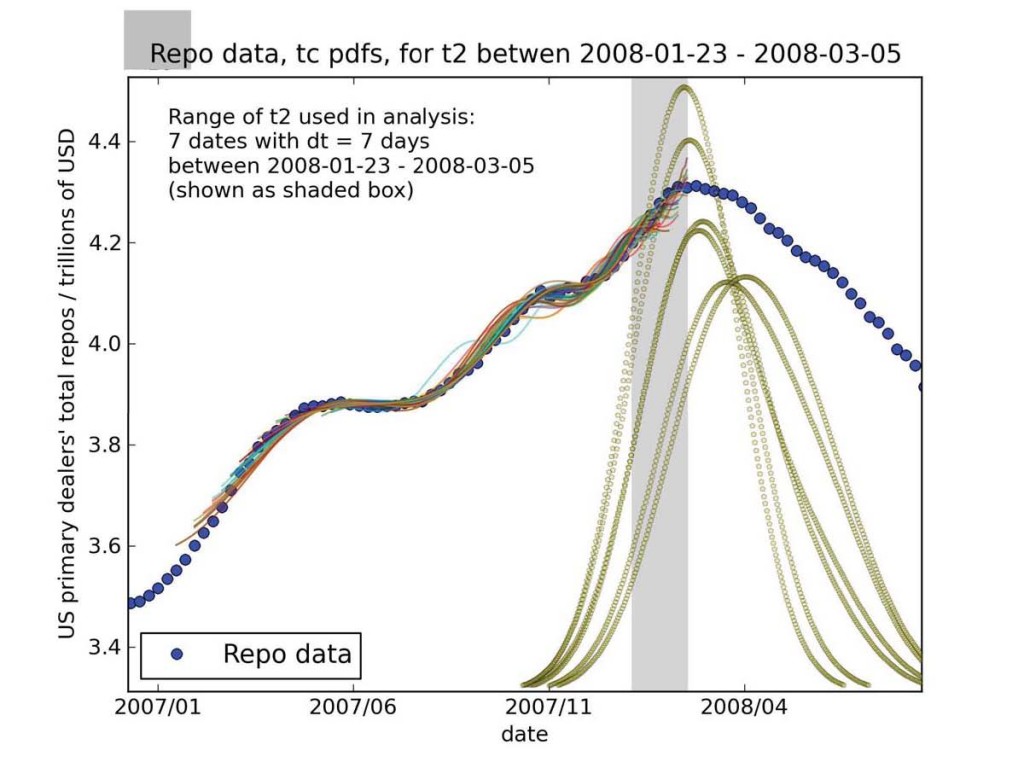
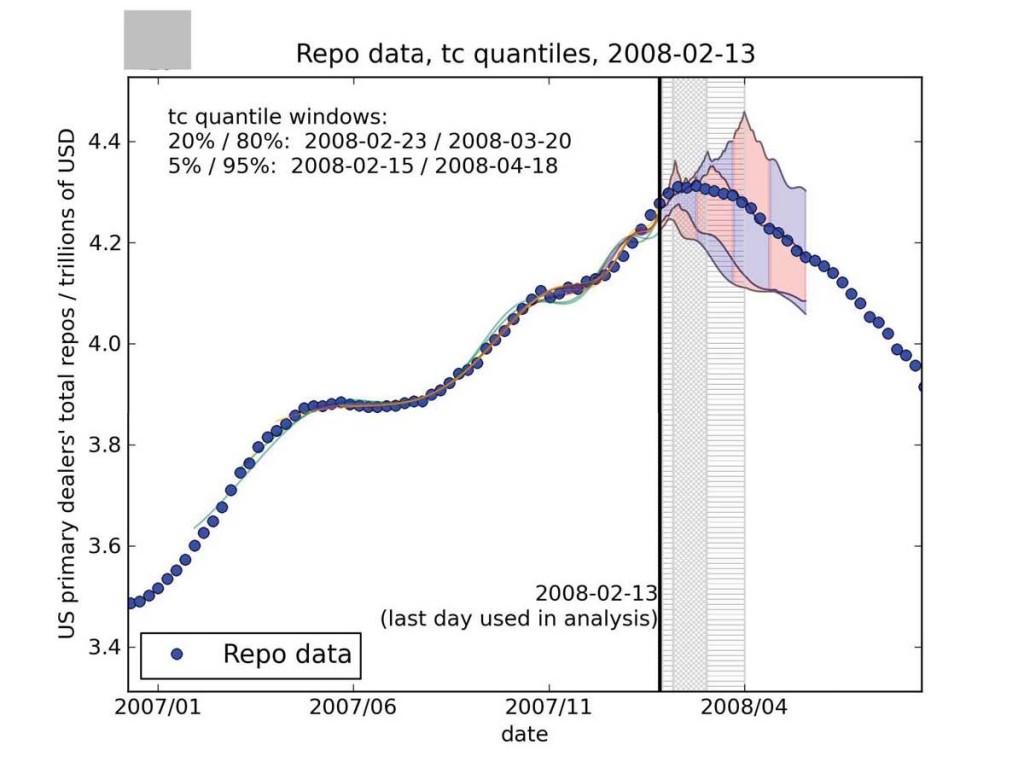
Looks like Didier Sornette has a new pre-print out on the arXiv. I’ve only had a minute or two to scan the paper, but it looks like they’ve slightly modified their JLS model to fit to the repo market to measure the “bubblieness” of leverage. They claim this allows them to some successful prediction, and make sure the reader connects this to the recent chatter at the Reserve and in Dodd-Frank on “detecting” bubbles or crises.

Abstract: Leverage is strongly related to liquidity in a market and lack of liquidity is considered a cause and/or consequence of the recent financial crisis. A repurchase agreement is a financial instrument where a security is sold simultaneously with an agreement to buy it back at a later date. Repurchase agreements (repos) market size is a very important element in calculating the overall leverage in a financial market. Therefore, studying the behavior of repos market size can help to understand a process that can contribute to the birth of a financial crisis. We hypothesize that herding behavior among large investors led to massive over-leveraging through the use of repos, resulting in a bubble (built up over the previous years) and subsequent crash in this market in early 2008. We use the Johansen-Ledoit-Sornette (JLS) model of rational expectation bubbles and behavioral finance to study the dynamics of the repo market that led to the crash. The JLS model qualifies a bubble by the presence of characteristic patterns in the price dynamics, called log-periodic power law (LPPL) behavior. We show that there was significant LPPL behavior in the market before that crash and that the predicted range of times predicted by the model for the end of the bubble is consistent with the observations.

Citation: W. Yan, R. Woodard, D. Sornette. Leverage Bubble. arXiv:1011.0458.

I also noticed that two of the EPS figures didn’t make it through arXiv’s compilation, so I’ve uploaded them here.

One of my more arcane working papers recently hit a few top-ten lists on SSRN last week with a whopping 10 downloads.  The paper is focused on improving one of the key signals in my Quantitative Finance, A Profitable Trading and Risk Management Strategy Despite Transaction Cost.  You can get it here or read the abstract below:

We present an adjusted method for calculating the eigenvalues of a time-dependent return correlation matrix that produces a more stationary distribution of eigenvalues. First, we compare the normalized maximum eigenvalue time series of the market-adjusted return correlation matrix to that of logarithmic return correlation matrix on an 18-year dataset of 310 S&P 500-listed stocks for two (small and large) window or memory sizes. We observe that the resulting new eigenvalue time series is more stationary than time series obtained through the use of existing method for each memory. Later, we perform this analysis while sweeping the window size τ ε {5, ..., 100} in order to examine the dependence on the choice of window size. We find that the three dimensional distribution of the eigenvalue time series for our market-adjusted return is significantly more stationary than that produced by the classic method.

Bommarito, Michael James and Duran, Ahmet, Spectral Analysis of Time-Dependent Market-Adjusted Return Correlation Matrix (May 26, 2010). Available at SSRN: http://ssrn.com/abstract=1672897

This post was originally published on September 3rd, 2007. It has been slightly modified from a previous version of the site.  N.B.: This code has been tested in Matlab R2009b and R2010a and still works fine.

Kaplan and Knowles, extending the original work of Shadwick and Keating as well as that of Kazemi, Schneeweis, and Gupta, describe a generalized downside risk-adjusted measure Kappa.  By design, the Omega and Sortino measures are special cases of the Kappa measure, and, as such, the Kappa function is capable of calculating both easily.

So that this very helpful function can be used by those in the community who are having difficulty with the original works, I am publishing a single-line Kappa function for Matlab.

% D : return series vector
% r : return threshold
% n : Kappa order
function k = kappa(D, r, n)
k = (mean(D) - r) ./ nthroot(mean((D < r) .* (r-D).^n), n);

To calculate the Omega measure, put n=1 and add 1 to the result, i.e. kappa(D, r, 1) + 1.

To calculate the Sortino ratio, put n=2, i.e. kappa(D,r,2).