This post was originally published on February 3rd, 2008. It has been slightly modified from a previous version of the site.
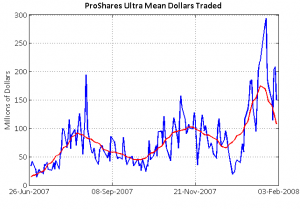
As volatility has increased over the past months, the ProShares Ultra ETFs have seen a dramatic increase in average dollar liquidity. There are exactly 50 of these leveraged instruments at the moment, and they are listed below, sorted by age.
| ETF | Age (sessions) |
| ProShares Ultra Dow30 | 407 |
| ProShares Ultra MidCap400 | 407 |
| ProShares Ultra S&P500 | 407 |
| ProShares Ultra QQQ | 406 |
| ProShares UltraShort Dow30 | 392 |
| ProShares UltraShort MidCap400 | 392 |
| ProShares UltraShort QQQ | 392 |
| ProShares UltraShort S&P500 | 392 |
| ProShares Ultra SmallCap600 | 258 |
| ProShares UltraShort SmallCap600 | 258 |
| ProShares UltraShort Russell2000 | 258 |
| ProShares Ultra Russell2000 | 258 |
| ProShares Ultra Oil & Gas | 253 |
| ProShares UltraShort Oil & Gas | 253 |
| ProShares Ultra Technology | 253 |
| ProShares UltraShort Health Care | 253 |
| ProShares Ultra Health Care | 253 |
| ProShares UltraShort Industrials | 253 |
| ProShares UltraShort Financials | 253 |
| ProShares UltraShort Real Estate | 253 |
| ProShares UltraShort Semiconductors | 253 |
| ProShares UltraShort Consumer Goods | 253 |
| ProShares Ultra Consumer Goods | 253 |
| ProShares Ultra Utilities | 253 |
| ProShares Ultra Semiconductors | 253 |
| ProShares Ultra Financials | 253 |
| ProShares UltraShort Technology | 252 |
| ProShares UltraShort Consumer Services | 252 |
| ProShares UltraShort Basic Materials | 252 |
| ProShares Ultra Consumer Services | 252 |
| ProShares Ultra Real Estate | 252 |
| ProShares Ultra Industrials | 252 |
| ProShares Ultra Russell1000 Growth | 239 |
| ProShares Ultra Russell2000 Growth | 239 |
| ProShares Ultra Russell MidCap Growth | 239 |
| ProShares UltraShort Utilities | 225 |
| ProShares UltraShort Russell1000 Value | 208 |
| ProShares UltraShort Russell MidCap Growth | 201 |
| ProShares UltraShort Russell2000 Value | 201 |
| ProShares UltraShort Russell MidCap Value | 201 |
| ProShares UltraShort Russell2000 Growth | 201 |
| ProShares Ultra Russell1000 Value | 201 |
| ProShares Ultra Russell2000 Value | 201 |
| ProShares Ultra Russell MidCap Value | 201 |
| ProShares Ultra Basic Materials | 201 |
| ProShares UltraShort Russell1000 Growth | 198 |
| ProShares UltraShort MSCI EAFE | 68 |
| ProShares UltraShort MSCI Emerging Market | 63 |
| ProShares UltraShort MSCI Japan | 58 |
| ProShares UltraShort FTSE/Xinhua China | 58 |
I’ve taken the product of the close and the volume for the 46 funds that have traded at least 150 sessions and averaged their daily cross-section. The following is a chart of this average dollar liquidity over the past 150 sessions in blue, with a 20-session moving average in red. The trend quite clearly indicates that not all market volatility is bad for ETFs.
