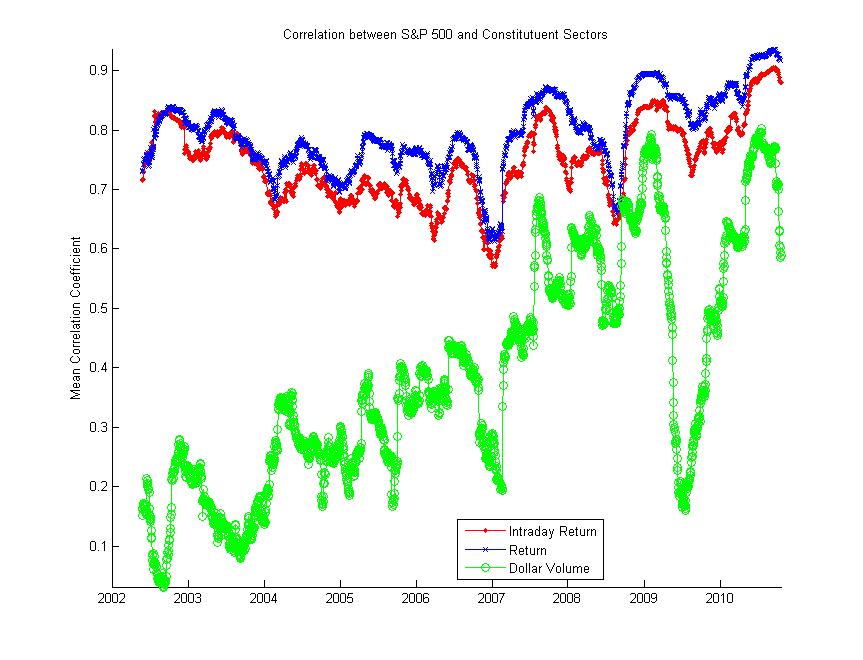
What does the trailing monthly correlation between the S&P 500 (SPY) and its constituent sectors (SPDR sector ETFs) look like over the past few years? The figure below shows this moving correlation for the intraday return (log close/open), regular return (log adjusted close), and total dollar volume (using open/close midpoint). It looks like we’re sitting just under the high set last week. I’ll let you decide how you think this factors into the ongoing discussion on correlation, but correlation periodicity may be more of an intraday than monthly thing.
P.S. This uses the Matlab code I posted for calculating moving correlations here.
