Here’s the beginning of an FT Alphaville article from this morning:

Whilst much has been written about the rise in correlation recently — what’s been less frequently observed is the strange disconnection that’s occurring between correlation and volatility.

The two traditionally move together. That is, correlation tends to rise and fall with volatility.

Yet as FT Alphaville discovered — whilst working on a special report on the subject of how increasing correlation is impacting banks’ structured products desks — what’s really puzzling at the moment is why correlation is refusing to budge lower as volatility has fallen.

Read the rest here – `Something exceptional’ is happening in volatility, correlation

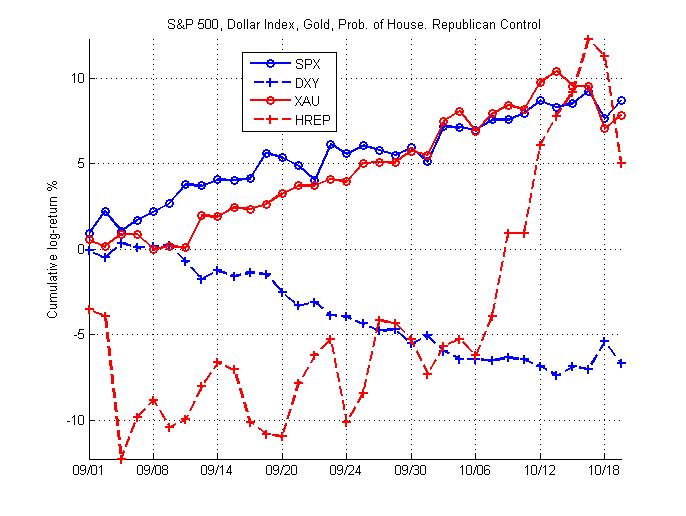
There's been a lot of talk lately about what factors might be driving the market.  The three factors I've seen suggested recently are the dollar, gold, and political expectations.  I thought I'd take a few moments to offer a very simple picture of the relationship since September.  The chart below shows the S&P 500 (SPX), the Dollar Index Futures (DXY), NYMEX Gold (XAU), and the InTrade probability that Republicans will control the House after the midterm.
I've taken two very simple approaches to assessing the relationships between these factors and the S&P 500.  They should be viewed as "approximations" at best.

The first approach is to calculate the correlation between the S&P 500 and these factors since September, both with and without a one-day lag.  

Without a lag, the correlation between the log-return of the S&P 500 and the dollar, gold, and political environment are -0.54, 0.37, and 0.17 respectively.  These coefficients can be interpreted as indicating that, within a given day, the S&P tends to move the opposite direction as the dollar and the same direction as gold and the probability of a Republican-controlled House.  Of these, the magnitude of the coefficient is largest on the dollar index, indicating that this relationship is likely strongest.

When we consider a lagged correlation between the S&P 500 and these factors, we obtain a different picture.  In this case, the correlation between the S&P 500's return tomorrow and today's return in the dollar, gold, and the probability of Republican House control are 0.55, -0.29, and -0.39 respectively.  These coefficients suggest the opposite of the within-day coefficients above, though the magnitude of the dollar correlation remains strongest.  This reverse relationship is likely due to the significant negative autocorrelation in the S&P 500 over the sample.

The second approach to assessing this relationship is to fit a GLM to the data to predict tomorrow's S&P 500 return from today's return in the factors.  In this case, I fit a simple normal model and obtain values of \beta of 0.79, 0.11, and -0.068 for the dollar index, gold, and probability of Republican-controlled House.  However, the t-statistic is only greater than 2 for the dollar index coefficient.

There are some measurement issues to address.  First, we're comparing the spot equity market to futures markets for gold and the dollar index.  Second, InTrade's probability of a Republican-controlled House is a very imperfect proxy for political environment. Not only does this probability ignore both the Senate and the Executive branch, but it also assumes that the House and Republican policy is capable of improving business climate.

However, taking this naive analysis at face value, it appears that the dollar does appear to be driving the S&P 500 more than gold or expectations of political environment.

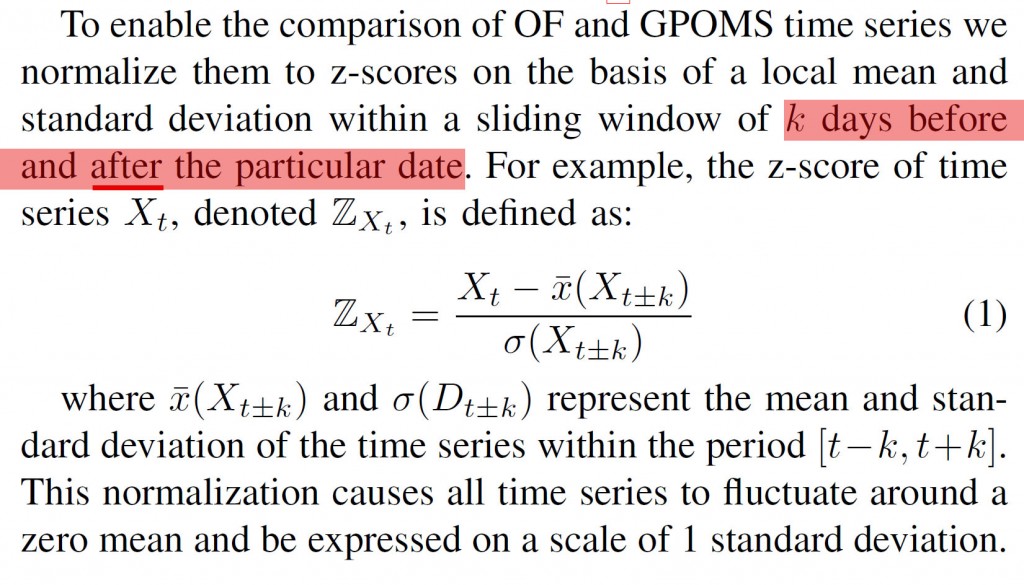
Update: Johan wrote me back this afternoon and confirmed that the z-scores are not used in assessing predictive power.  I think future drafts of the paper will be much more clear on this point, as apparently similar concerns had been raised by others.  Based on Johan's statements, I'd like to emphasize that this paper does rigorously support the claim that Twitter can be used to help predict the direction of the Dow for their sample.  Though directional prediction does not necessarily equate to profitable strategy, this is an exciting conclusion.  I think the paper would benefit most from a portfolio backtesting instead of just directional prediction, and perhaps an extensions to either interest rates or the something like the VIX.  All in all, I'm excited to see future research from their group.

As I noted when I first linked to this paper on arXiv, I think there may be an issue with the claim of prediction.  Here is the portion of text that raises some serious questions in my mind.  Emphasis is mine.


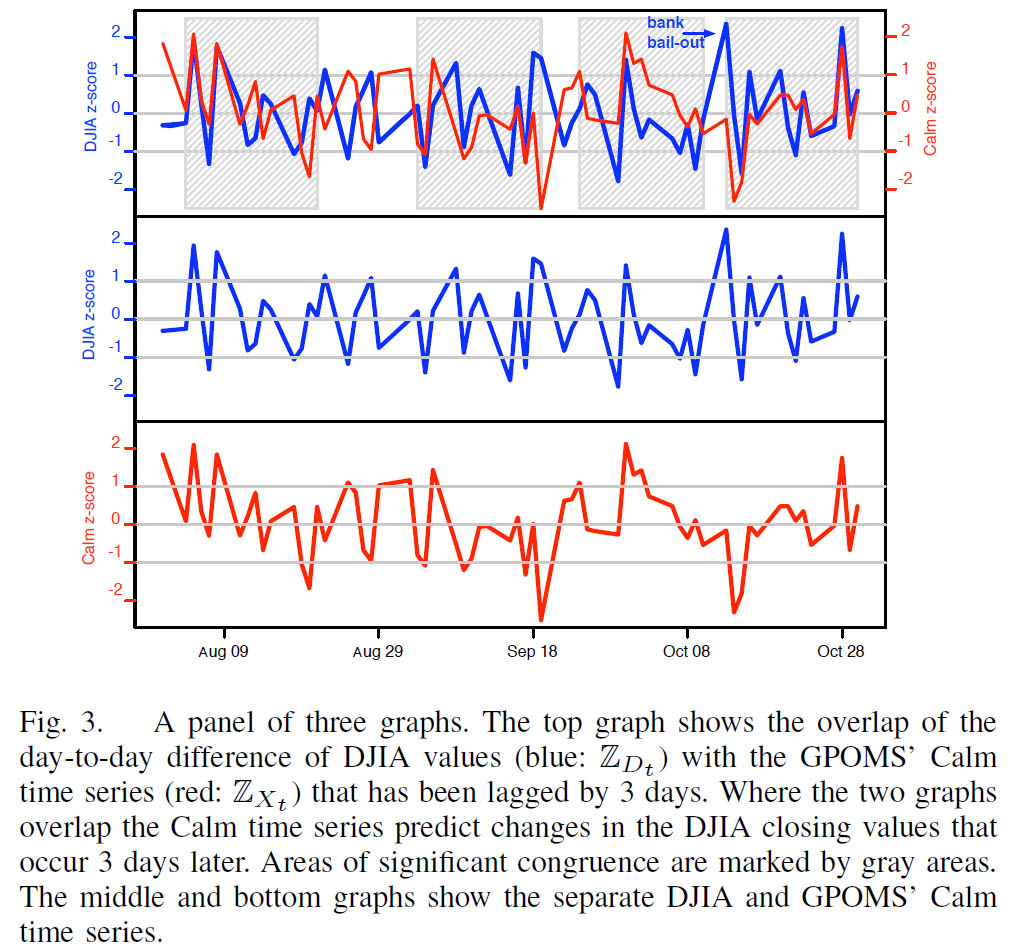
Note then that the assessment of predictive power later uses these z-scores, which are clearly not out-of-sample since they incorporate $k$ periods of future knowledge. Figure 3 and its caption below drive this point home, as they clearly indicate that $Z_t$ is used here.


The remainder of the text is somewhat ambiguous.

I've emailed the authors twice over the last week, and despite the fact that they visited my personal homepage through the email, I've received no response.  In the meantime, I think the jury is out on whether Twitter can actually be used to rigorously, out-of-sample predict the stock market.

Another paper of note on q-fin last night. Though this one isn't completely new, I thought it was worth noting since H. Eugene Stanley has received quite a bit of press with his "financial earthquake" research.

We study the cascading dynamics immediately before and immediately after 219 market shocks. We define the time of a market shock T_{c} to be the time for which the market volatility V(T_{c}) has a peak that exceeds a predetermined threshold. The cascade of high volatility "aftershocks" triggered by the "main shock" is quantitatively similar to earthquakes and solar flares, which have been described by three empirical laws — the Omori law, the productivity law, and the Bath law. We analyze the most traded 531 stocks in U.S. markets during the two-year period 2001-2002 at the 1-minute time resolution. We find quantitative relations between (i) the "main shock" magnitude M \equiv \log V(T_{c}) occurring at the time T_{c} of each of the 219 "volatility quakes" analyzed, and (ii) the parameters quantifying the decay of volatility aftershocks as well as the volatility preshocks. We also find that stocks with larger trading activity react more strongly and more quickly to market shocks than stocks with smaller trading activity. Our findings characterize the typical volatility response conditional on M, both at the market and the individual stock scale. We argue that there is potential utility in these three statistical quantitative relations with applications in option pricing and volatility trading.

Alexander M. Petersen, Fengzhong Wang, Shlomo Havlin, H. Eugene Stanley. Market dynamics immediately before and after financial shocks: quantifying the Omori, productivity and Bath laws. 82 Phys. Rev. E., forthcoming (2010). http://arxiv.org/abs/1006.1882

If you're interested in smaller, bite-sized thoughts and less of the post-length stuff, feel free to follow ETF Central on Twitter.  I'll often post headlines as they hit the newswire with short thoughts and follow-up links.  (If you're so inclined, you can also follow me as a person.)

Here's the official word from NYSE on last night's 4:15 SPY flash crash:

"On Monday, October 18, the 4 pm ET closing auction in NYSE Arca primary listed symbols was delayed due to an issue with a software release, causing the auction cycle to run at 4:15 pm ET. These auction prices, occurring at 4:15 pm ET, constitute the official exchange closing prices for these issues, with the exception of ‘SPY.’ All trades in the closing auction in ‘SPY,’ which occurred at a price of $106.46, were ruled to be broken by NYSE Arca Market Management. The official closing price will be marked at [4:15 pm] utilizing the valid prior print of $118.28."

I'll point you at the NYSE ARCA Closing Auction page, which claims that closing auctions are single-price Dutch auctions.  I could imagine this resulting in a flash crash upwards, but not downwards!   I also don't understand how $500M worth of liquidity could have gone through at this price, since this is just supposed to be order-matching. Someone could possibly have known that this were an issue and entered a giant LOC @ 106.46 for 4.5M shares, but that seems unlikely.

Also, if this were really just a simple software error, why didn't they re-run the auction with the submitted bids?  My understanding of the process is that these MOC/LOC orders should all be submitted prior to the 4:15 print, which means that the auction could have been replayed with the correct software.

Edit: Here's a document from ITG that explains the closing auction in more detail.  Also note that there was no share imbalance reported in SPY yesterday.

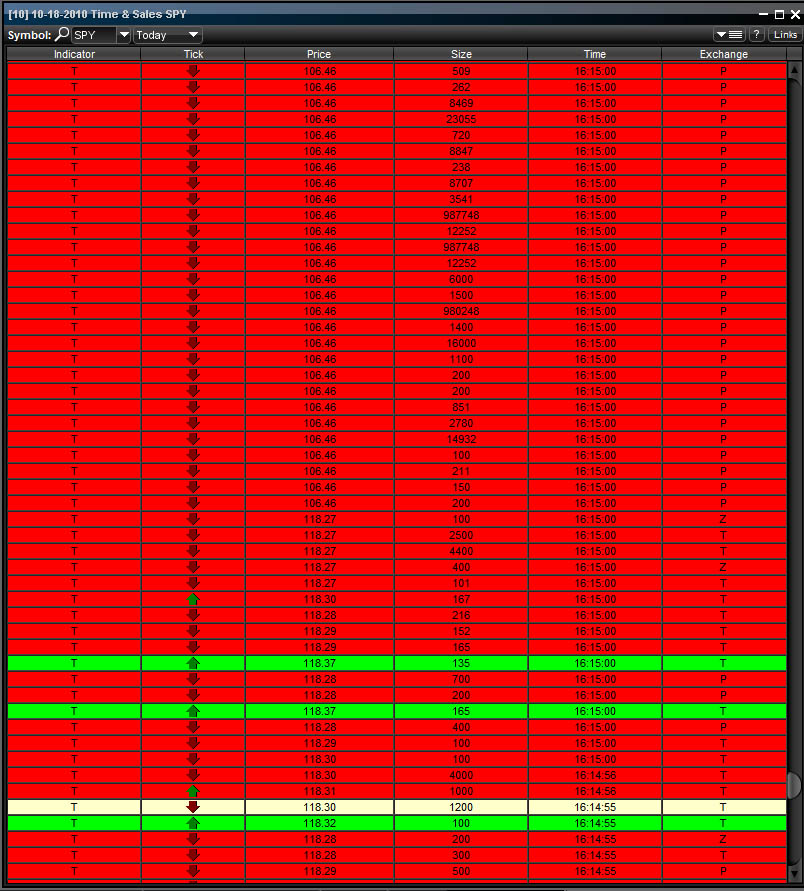
At exactly 16:15:00 today, the SPDR S&P500 ETF SPY, one of the most traded equity assets in the world, experienced a flash crash.  The first 15 trades in this second executed between 118.25 and 118.40.  However, the next 150 trades were executed at 106.46, 10.5% lower than the previous transactions.  Within less than a single second, just under $500M in notional value traded hands at this flash crash price.  The figure below shows the first of these transactions, all of which went through on exchange P, the Pacific Stock Exchange.


Not much was publicly known between 16:15pm and the release of a Bloomberg article claiming that NYSE Euronext had ruled on cancelling these orders (subject to appeal).  As of 19:00 EST, there is still an 800 share bid at 106.46.

It will be interesting to see in the coming days whether anyone comes forward to appeal these busts.  A comment at ZeroHedge already suggests that these trade cancellations don't meet the SEC's policy.

Final Edit: There are two new posts on the topic.  The first is a more coherent summary of the information in this post.  The second addresses the NYSE's official line on the story.

Edit: Looks like that was the official closing price on NYSE, not afterhours. However, no trade at that price is showing up in time&sale data between 13:59 and 14:00 for me.

Edit 2: Comment on ZH claims the 106.46 trade was worth $7M.

Edit 3: Bloomberg claims NYSE Euronext is cancelling these trades.

Edit 4: Found the T&S time range thanks to the Bloomberg article.

Edit 5: There's still a 106.46 bid for 100 listed under NSDQ in the order book.  Edit (again!): Same order up to 800 shares now.

Edit 6: Did some addition by hand and got just under $500M USD in actual executed trades at 106.46.

Looks like there was an after-hours flash crash in the SPDR S&P 500 ETF SPY…printed low at 106.46.  Spent awhile digging through T&S data and can't find it in Power E*Trade Pro.  Still no official word from NYSE ARCA and there's general confusion across Twitter.