It seems like many of my posts lately have been critical of others lately (#1: POMO, #2: Dollar / Gold, #3: Twitter ). On the downside, everybody wants to get along and nobody makes friends on the attack. On the upside, it’s good for plenty of site hits and provides two sides to a discussion.
So what the hell, here it goes – here’s why I think the ZeroHedge submitted/accepted ratio post gets it wrong. (Note that all of the analysis, both here and by John Lohman, suffers from an in-sample issue. None of this is really a strategy that could be implemented without information about the submitted-to-accepted ratio in advance. This may still be profitable if you took the positions at 11am instead of 9:30am, but none of the data we’re providing proves it. I will be performing real intraday analysis with out-of-sample backtesting in the paper I’m working on right now).
First of all, I think John Lohman’s logic is mostly right in the hypothesis. If the “conspiracy theory” is really true, then the ratio of submitted-to-accepted should be proportional to the market’s return. However, there are a few points I’d like to make for rigor’s sake here.
- First, why can’t PDs go short too? Maybe it makes more sense to put the absolute value of the market’s return on the LHS, dropping the sign. (Hint: See below if you want the answer!)
- Second, there are a number of alternate hypotheses that are not conspiracy-like that could also result in this proportional relationship. Maybe market participants just take some days of the week off, and the Fed chose to schedule POMO on days that would have higher liquidity anyway. If you were Brian Sack, wouldn’t you want to schedule these operations on days where the most PDs would participate or they would be best staffed?
- Third, just to emphasize it again, neither John nor I are actually presenting these analyses as something you can take to the market. The submitted-accepted ratio comes out after the operation begins, which is never before 9:30am, which means you could never realize the returns we’re showing precisely. For a strategy you can actually execute, see yesterday’s post (but don’t assume it’s profitably stable).
- Fourth, I’ve switched from submitted-to-accepted to accepted-to-submitted. This makes everything easier to see and interpret.
OK, so again, John’s logic is decent enough. If I had to guess, Tyler at ZH likely added his own emphasis to the post “for effect,” which might have masked some of John’s real tone. So down to the brass tacks and the data. First of all, I’m using the SPY for the S&P 500 and my POMO dataset for information on the submitted-to-accepted ratio. I’m also publishing the Matlab code here, just for full disclosure sake.
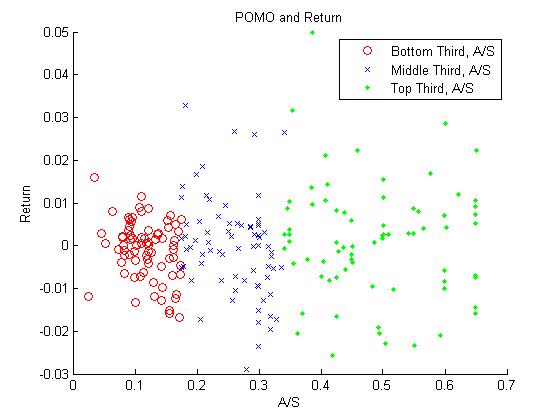
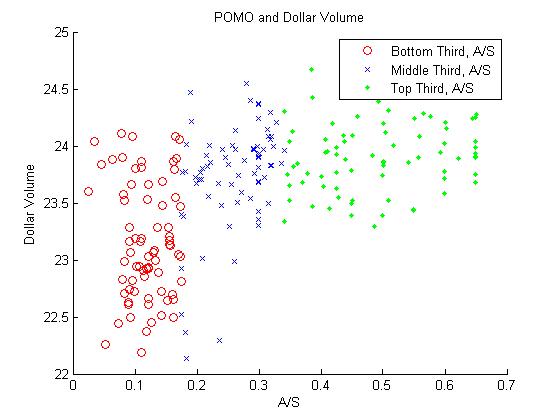
Now, if you run this code, you’ll see the following two scatter plots pop up. The red are the bottom third of the POMO operations by accepted-to-submitted ratio, the blue are the middle third, and the green are the top third.
OK, so it looks like there’s definitely something going on for the dollar volume. However, the story for the return is a little bit more fuzzy. It appears that the spread increases as the accepted-to-submitted ratio increases, but not necessarily that there is a strong direction to the sign. Maybe, as I mentioned above, the magnitude of the return is what’s proportional, not just the value. As you can see in the Matlab code, I fit a simple GLM for each of these and get the following:
- log(close) – log(open) ~ accepted/submitted ratio: The coefficient on the ratio is slightly positive (0.0066, +-0.0047) but the t-stat is 1.4. No go.
- log(dollar volume) ~ accepted/submitted ratio: The coefficient is on the ratio is definitely positive (1.75, +-0.18) and the t-stat is 9.6. This conclusion is definitely supported – the ratio of accepted-to-submitted is proportional to the total dollars traded on SPY.
- abs(log(close) – log(open)) ~ accepted/submitted ratio: In this case, the coefficient is definitely positive (0.0159, +-0.0032) and the t-stat 5.0. This conclusion is also supported – the ratio of accepted-to-submitted is proportional to the magnitude of SPY’s return, but not necessarily the direction.
So there you have it – the dollar volume and magnitude of the change are statistically significantly related to the POMO accepted-to-submitted ratio, but the direction is not really guaranteed. Much more of this to come in a research paper I’m currently working on.

