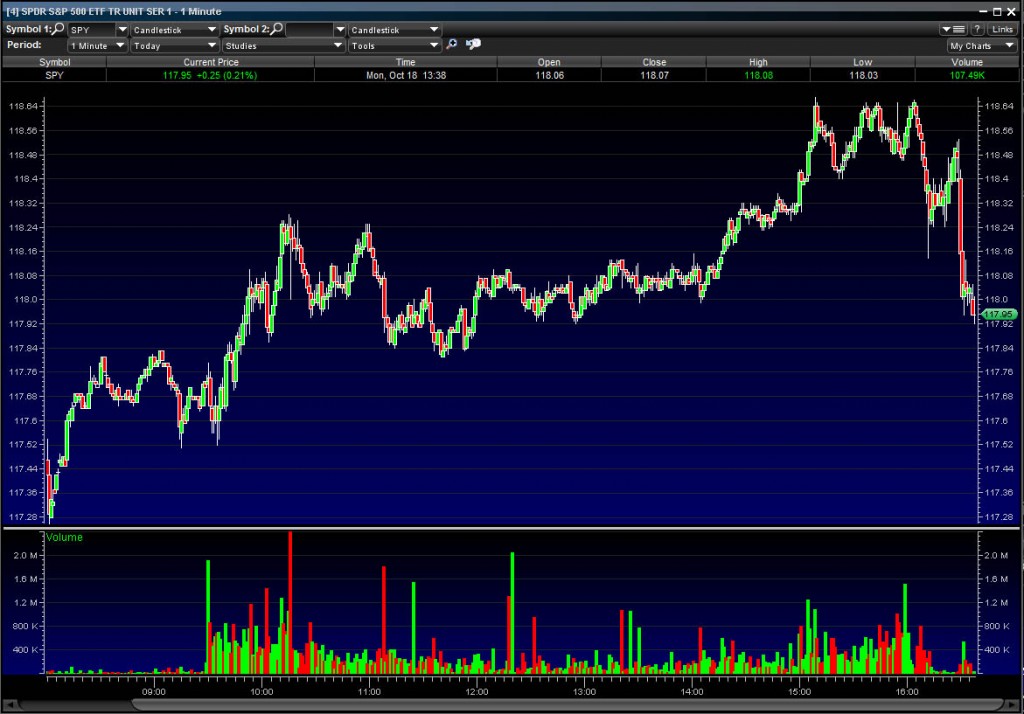
Here's the official word from NYSE on last night's 4:15 SPY flash crash:

"On Monday, October 18, the 4 pm ET closing auction in NYSE Arca primary listed symbols was delayed due to an issue with a software release, causing the auction cycle to run at 4:15 pm ET. These auction prices, occurring at 4:15 pm ET, constitute the official exchange closing prices for these issues, with the exception of ‘SPY.’ All trades in the closing auction in ‘SPY,’ which occurred at a price of $106.46, were ruled to be broken by NYSE Arca Market Management. The official closing price will be marked at [4:15 pm] utilizing the valid prior print of $118.28."

I'll point you at the NYSE ARCA Closing Auction page, which claims that closing auctions are single-price Dutch auctions.  I could imagine this resulting in a flash crash upwards, but not downwards!   I also don't understand how $500M worth of liquidity could have gone through at this price, since this is just supposed to be order-matching. Someone could possibly have known that this were an issue and entered a giant LOC @ 106.46 for 4.5M shares, but that seems unlikely.

Also, if this were really just a simple software error, why didn't they re-run the auction with the submitted bids?  My understanding of the process is that these MOC/LOC orders should all be submitted prior to the 4:15 print, which means that the auction could have been replayed with the correct software.

Edit: Here's a document from ITG that explains the closing auction in more detail.  Also note that there was no share imbalance reported in SPY yesterday.
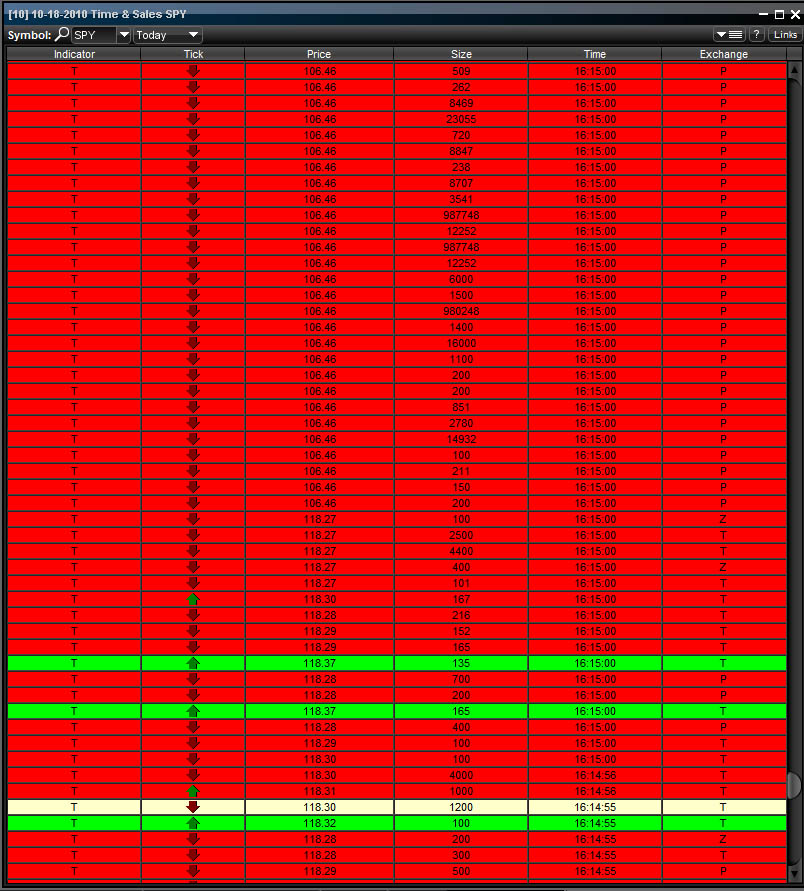
At exactly 16:15:00 today, the SPDR S&P500 ETF SPY, one of the most traded equity assets in the world, experienced a flash crash.  The first 15 trades in this second executed between 118.25 and 118.40.  However, the next 150 trades were executed at 106.46, 10.5% lower than the previous transactions.  Within less than a single second, just under $500M in notional value traded hands at this flash crash price.  The figure below shows the first of these transactions, all of which went through on exchange P, the Pacific Stock Exchange.


Not much was publicly known between 16:15pm and the release of a Bloomberg article claiming that NYSE Euronext had ruled on cancelling these orders (subject to appeal).  As of 19:00 EST, there is still an 800 share bid at 106.46.

It will be interesting to see in the coming days whether anyone comes forward to appeal these busts.  A comment at ZeroHedge already suggests that these trade cancellations don't meet the SEC's policy.

Final Edit: There are two new posts on the topic.  The first is a more coherent summary of the information in this post.  The second addresses the NYSE's official line on the story.

Edit: Looks like that was the official closing price on NYSE, not afterhours. However, no trade at that price is showing up in time&sale data between 13:59 and 14:00 for me.

Edit 2: Comment on ZH claims the 106.46 trade was worth $7M.

Edit 3: Bloomberg claims NYSE Euronext is cancelling these trades.

Edit 4: Found the T&S time range thanks to the Bloomberg article.

Edit 5: There's still a 106.46 bid for 100 listed under NSDQ in the order book.  Edit (again!): Same order up to 800 shares now.

Edit 6: Did some addition by hand and got just under $500M USD in actual executed trades at 106.46.

Looks like there was an after-hours flash crash in the SPDR S&P 500 ETF SPY…printed low at 106.46.  Spent awhile digging through T&S data and can't find it in Power E*Trade Pro.  Still no official word from NYSE ARCA and there's general confusion across Twitter.

One of my more arcane working papers recently hit a few top-ten lists on SSRN last week with a whopping 10 downloads.  The paper is focused on improving one of the key signals in my Quantitative Finance, A Profitable Trading and Risk Management Strategy Despite Transaction Cost.  You can get it here or read the abstract below:

We present an adjusted method for calculating the eigenvalues of a time-dependent return correlation matrix that produces a more stationary distribution of eigenvalues. First, we compare the normalized maximum eigenvalue time series of the market-adjusted return correlation matrix to that of logarithmic return correlation matrix on an 18-year dataset of 310 S&P 500-listed stocks for two (small and large) window or memory sizes. We observe that the resulting new eigenvalue time series is more stationary than time series obtained through the use of existing method for each memory. Later, we perform this analysis while sweeping the window size τ ε {5, ..., 100} in order to examine the dependence on the choice of window size. We find that the three dimensional distribution of the eigenvalue time series for our market-adjusted return is significantly more stationary than that produced by the classic method.

Bommarito, Michael James and Duran, Ahmet, Spectral Analysis of Time-Dependent Market-Adjusted Return Correlation Matrix (May 26, 2010). Available at SSRN: http://ssrn.com/abstract=1672897

Edit: I've uploaded my sample of Wells Fargo PDFs and a spreadsheet comparing them.

Edit 2: Found a PDF on the wellsfargo.com site that's a close match.   Updating my probabilities a little towards real and away from fake…

ZeroHedge released a document that they claim is the soon-to-be-released Repurchase Process at Wells Fargo.  I wanted to take a few minutes to see whether this document passed the smell test.

First, the PDF has an author tag – Sean Lacy.  According to LinkedIn, Sean Lacy does appear to be a Wells Fargo implementation consultant based out of the Twin Cities.  Furthermore, if you were to search for a Wells Fargo employee working in implementation, Sean wouldn't be the first one you'd find.  A quick scan of LinkedIn and Google indicates that there would have been quite a few employees you might have chosen instead  to fabricate this document.

Second, the document does also have a company tag – Wells Fargo & Co.  However, I've downloaded a sample of around 20 PDFs from the wellsfargo.com site and none of them contain this tag.

However,  some other pieces aren't adding up.  For instance,  the document creation is set to 12:32pm on Oct. 12.  It was modified just over a day later.  A Wells Fargo spokesman seemed to imply that the process was under review as early as October 5th, which would have given them at least a week to review the lawyers' briefs.  However, the document text indicates that it is dated October 15th (with a typo).  It seems strange that a document that was delayed for review for this long would have a typo in the date.

There are some software questions too.  I've gone through 20 PDFs, four of which were from the last 6 months, and found none that were produced by Acrobat PDFMaker 9.0 for Word.  Most documents were either produced by InDesign or used Acrobat 6.0 software.  I'm not sure how diverse the IT infrastructure is at Wells Fargo, but I'd assume that software versions don't differ that much across the firm. There are some more little things…the font doesn't match the fonts used in any other documents.   The disclaimer text also doesn't follow the standard I've seen thus far of indicating subsidiary roles (see this other "internal" document).

All in all, I'm not sure I believe this is the real deal.

Despite the recent decline in front and future VIX prices, many traders have recently taken speculative positions on increasing price ranges.  I decided to highlight the ten exchange-traded assets that had the widest weekly ranges as a proportion of Friday's closing price.  In addition to presenting just the range, I'm also providing the week's return, total dollar volume, and correlation to the S&P and gold.


Symbol Return Range Dollar Volume ($M) SPY Correlation GLD Correlation
TMF -11.1% 15.3% 28.461793 94.3% 66.0%
TYP -11.2% 15.1% 59.262521 -41.9% 55.7%
ZSL -10.5% 14.7% 64.935627 -5.7% -93.7%
SQQQ -10.6% 14.5% 163.841642 -39.0% 59.1%
CZM 7.9% 13.3% 25.011599 69.7% 91.9%
CZI -7.7% 13.2% 2.204423 -77.5% -82.7%
TMV 11.0% 13.2% 103.653646 -95.4% -63.2%
FAS -5.5% 12.8% 4001.066165 64.8% 28.1%
TYH 10.6% 12.7% 144.928741 43.9% -56.6%
TZA -4.4% 12.6% 2530.503744 -77.6% -87.2%


The results shouldn't be too surprising.  The pack is led by leveraged funds that track technology, Treasury, and commodities.  TYP, TYH, and SQQQ all correspond to triple-leverage Nasdaq or broad tech funds; of these, TYH and SQQQ were much more heavily traded this week.  Treasury funds hold their own as well, with the triple 20-year (TMF) and the triple short 30-year (TMV) showing large ranges this week.   ZSL is a double-leverage short silver fund, and CZM/CZI are triple-leveraged long/short China funds; much of the move in both Chinese and commodity markets this week was driven by the dollar.  Of all these funds, the triple-leverage financial ETF (FAS) clearly saw the most trading action, churning more than $4B this week.  With plenty of housing, job, and industrial data out next week, look for these funds to continue to expand on their recent price ranges.  

“Faith-based” investing, a close cousin of “socially responsible” investing, has received an increasing amount of attention over the past decade.  Though both of these trends have been adversely affected by the recent downturn, I thought we’d check in to see how the family of funds issued by FaithShares Advisors, LLC has fared year-to-date.  FaithShares offers funds for five “different” faiths – Catholic, Lutheran, Methodist, Christian, and Baptist values.

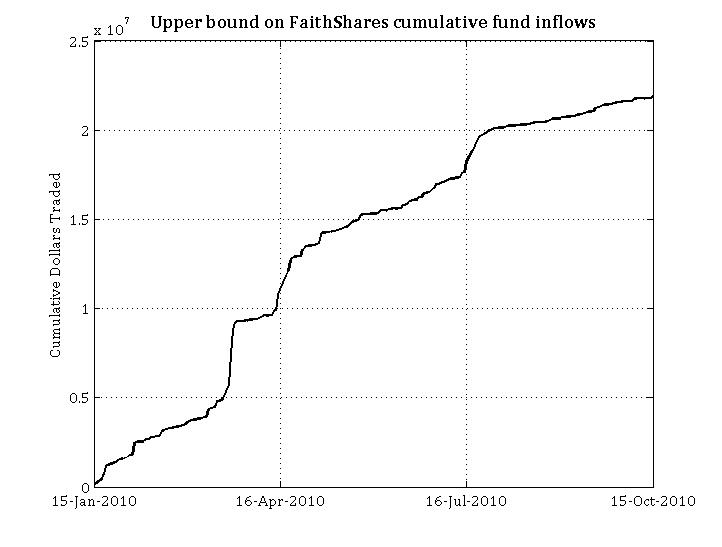
The first figure belows shows the upper bound on fund inflows since January 15th.  The upper bound logic is based on the following two tricks.  First, I’ve calculated dollars traded based on each day’s price high.  Second, if you assume that every share traded represents an inflow and not an outflow, then the number of dollars traded represents the maximum possible inflow.  The first figure below shows that this upper bound is just under $22 million dollars.

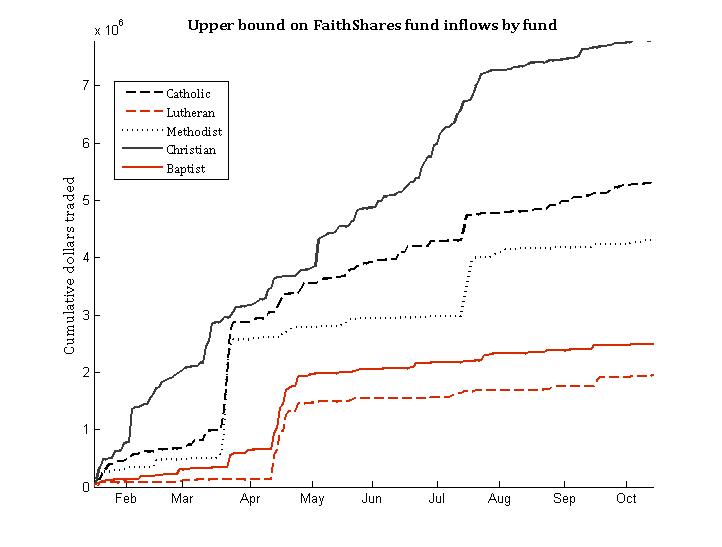
The second figure shows this upper bound on inflows by each faith.  The broad, Christian based fund appears to have attracted the most interest with an upper bound of $7.78M.  The Catholic and Methodist funds follow far behind with upper bounds of $5.35M and $4.30M respectively.  The Baptist and Lutheran funds round out the pack with a respective $2.49M and $1.96M.

To put this into perspective, more dollars are usually traded in SPY in the first 10 seconds after 9:30AM.  If you’re interested in more of the details on the internal management of these funds and FaithShares Advisors, LLC, please refer to their last Certified Shareholder Report on EDGAR.

It’s hard to keep up with all the exchange-traded assets out there.  For a few years, there were new ETFs every month. Issuers then began to experiment with other exchange-traded assets.  In the past  year, there have even been exchange-traded asset delistings.  You could track this all down through filings in the SEC database, but MasterDATA has done this for you.  I keep my list of exchanged-traded and closed-end funds updated through their very helpful list.

I took some time to combine this list with some additional data on the asset’s issuer, type, net assets, and dividend yield. Though the last two are not always available, the data may be useful for someone in this form.  You can download the ETF spreadsheet here.