Data has driven finance forward in ways that theory alone could not have.  In recent years, a similar trend has developed in the study of law, especially within fields such as “law and economics” or “empirical legal studies.”  I find this “data-driven” approach to law fascinating (having been introduced to it by Dan), and have been active in a number of projects on the topic.

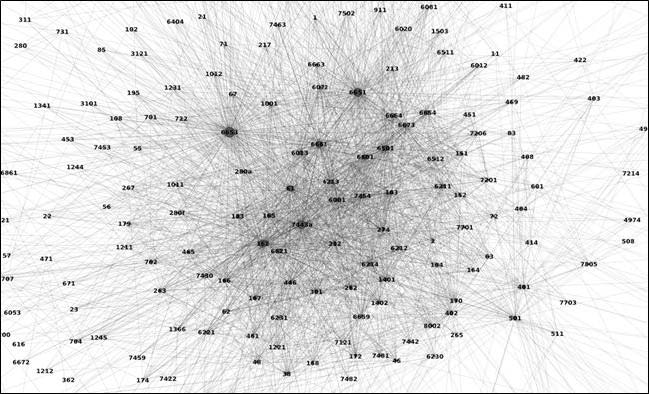
The paper below, which is forthcoming in the Virginia Tax Review (one of the top three tax reviews), is an excellent example of this trend. In it, we examine a number of aspects of the population of the Tax Court’s written decisions. Obtaining and analyzing these decisions required a significant degree of technical sophistication, and interpreting the results in their legal context has provided a number of insights. The abstract is below:

Abstract: What can empirical data tell us about the jurisprudence of United States Tax Court? Which sections of the Internal Revenue Code are most frequently cited and has recent tax legislation sparked change in the Tax Court’s decisions? This article presents an analysis of the citation practices of the United States Tax Court between 1990 and 2008. While previous citation studies focus on case-to-case citations, we modify this approach to focus on statutory citations, which better capture the nature of tax jurisprudence. By applying techniques from computer science, we collect and analyze more than 11,000 decisions and 244,000 statutory citations authored by the United States Tax Court between 1990 and 2008. Our approach includes both a static and longitudinal analysis of the most cited Internal Revenue Code sections. In addition, we carry out a network analysis of these case-to-statute citations to uncover patterns in citation practices, concept relationships, and legislative acts. This article answers the call for greater empiricism in tax scholarship and paves the way for future research on Tax Court jurisprudence.

M. J. Bommarito II, D. M. Katz, J. Isaacs-See. An Empirical Study of the Population of United States Tax Court Written Decisions (1990- 2008). Forthcoming, Virginia Tax Review, 2010. http://ssrn.com/abstract=1441007.
Another one fresh off the pre-printing press at arXiv. Having skimmed the paper, this looks like a serious treatment of a very serious problem – reconstructing the coefficient on the correlation term of models when returns are sampled asynchronously, as is almost always the case when using tick data.  On a related note, Section 2 is the best presentation of the Epps effect in this context I’ve seen.

Abstract: A detailed analysis of correlation between stock returns at high frequency is compared with simple models of random walks. We focus in particular on the dependence of correlations on time scales – the so-called Epps e ect. This provides a characterization of stochastic models of stock price returns which is appropriate at very high frequency.

I. Mastromatteo, M. Marsili, P. Zoi. Financial correlations at ultra-high frequency: theoretical models and empirical estimation. arXiv:1011.1011

I’m going to assume that you’ve heard that the number is $600B in expansion, putting the total amount of purchases including reinvestment at just shy of $1T. Here are some excerpts from the official statement that are more interesting, as well as my emphasis added in bold:

Purchases associated with balance sheet expansion and those associated with principal reinvestments will be consolidated into one set of operations to be announced under the current monthly cycle. On or around the eighth business day of each month, the Desk will publish a tentative schedule of purchase operations expected to take place through the middle of the following month, as well as the anticipated total amount of purchases to be conducted over that period. The schedule will include a list of operation dates, settlement dates, security types to be purchased (nominal coupons or TIPS), the maturity date range of eligible issues, and an expected range for the size of each operation.

The Desk expects to conduct the November 4 and November 8 purchase operations that were announced on October 13, and it plans to publish its first consolidated monthly schedule on November 10 at 2:00 p.m.

Purchases will be conducted with the Federal Reserve’s primary dealers through a series of competitive auctions operated through the Desk’s FedTrade system. Consistent with current practices, the results of each operation will be published on the Federal Reserve Bank of New York’s website shortly after each purchase operation has concluded. In order to ensure the transparency of our purchase operations, the Desk will also begin to publish information on the prices paid in individual operations at the end of each monthly calendar period, coinciding with the release of the next period’s schedule.

Note that this means that much more out-of-sample prediction may be possible in the future for POMO, both due to better prospective data release and higher detail in released training data.

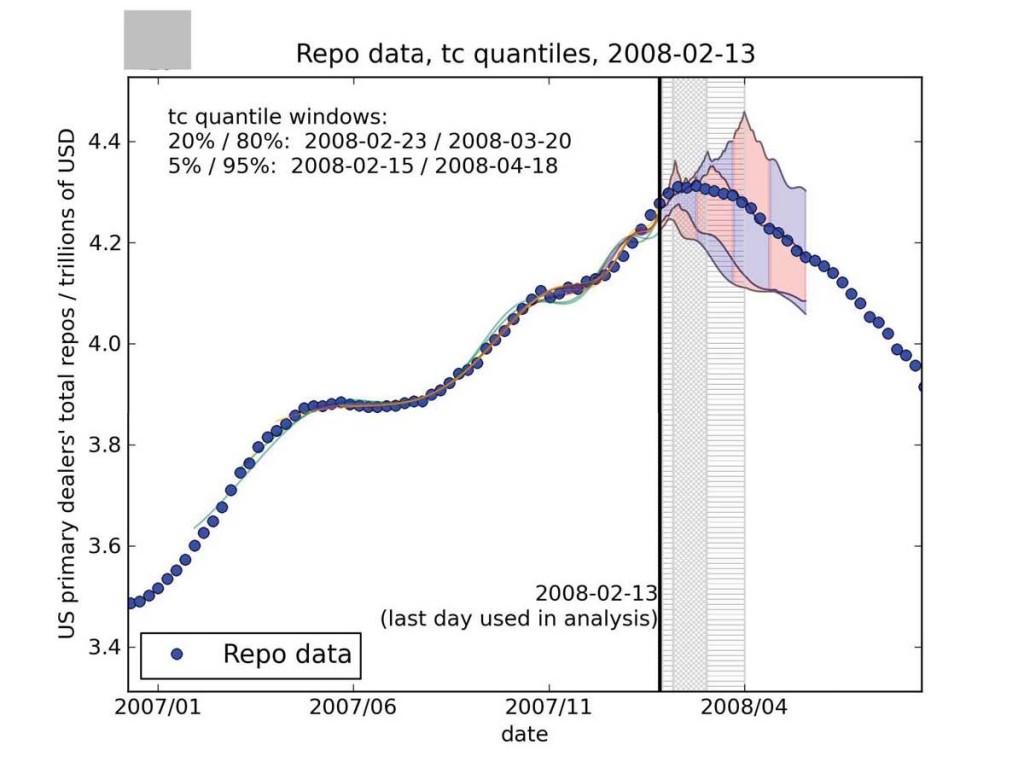
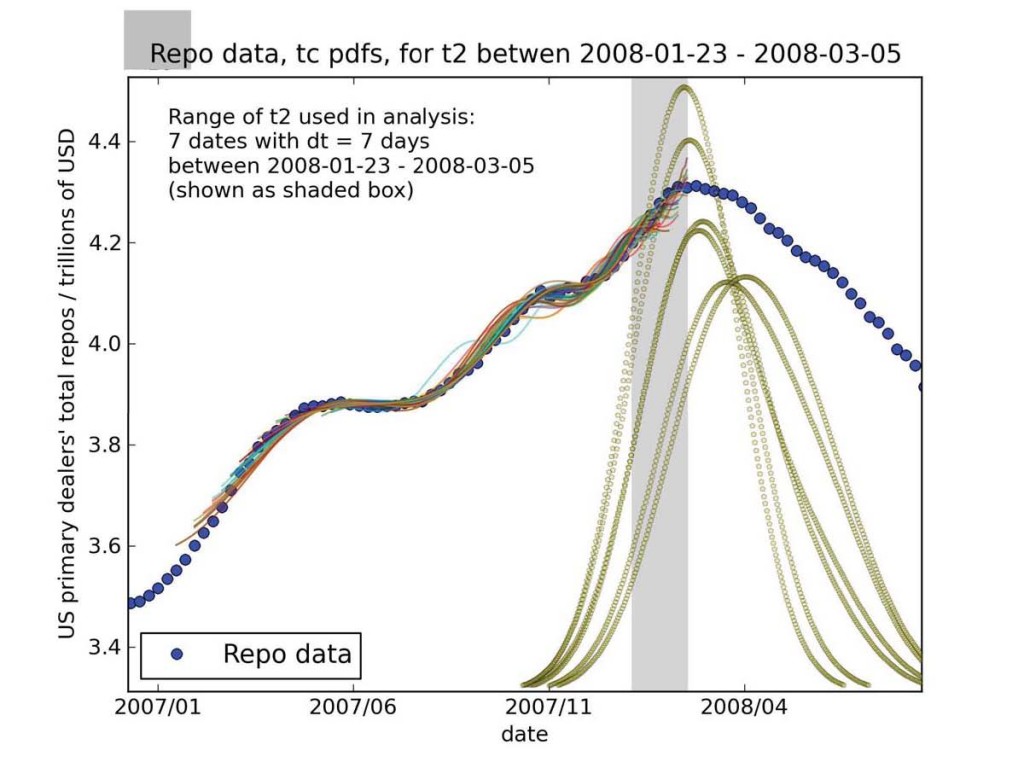
Looks like Didier Sornette has a new pre-print out on the arXiv. I’ve only had a minute or two to scan the paper, but it looks like they’ve slightly modified their JLS model to fit to the repo market to measure the “bubblieness” of leverage. They claim this allows them to some successful prediction, and make sure the reader connects this to the recent chatter at the Reserve and in Dodd-Frank on “detecting” bubbles or crises.

Abstract: Leverage is strongly related to liquidity in a market and lack of liquidity is considered a cause and/or consequence of the recent financial crisis. A repurchase agreement is a financial instrument where a security is sold simultaneously with an agreement to buy it back at a later date. Repurchase agreements (repos) market size is a very important element in calculating the overall leverage in a financial market. Therefore, studying the behavior of repos market size can help to understand a process that can contribute to the birth of a financial crisis. We hypothesize that herding behavior among large investors led to massive over-leveraging through the use of repos, resulting in a bubble (built up over the previous years) and subsequent crash in this market in early 2008. We use the Johansen-Ledoit-Sornette (JLS) model of rational expectation bubbles and behavioral finance to study the dynamics of the repo market that led to the crash. The JLS model qualifies a bubble by the presence of characteristic patterns in the price dynamics, called log-periodic power law (LPPL) behavior. We show that there was significant LPPL behavior in the market before that crash and that the predicted range of times predicted by the model for the end of the bubble is consistent with the observations.

Citation: W. Yan, R. Woodard, D. Sornette. Leverage Bubble. arXiv:1011.0458.

I also noticed that two of the EPS figures didn’t make it through arXiv’s compilation, so I’ve uploaded them here.

I’m attaching a copy of the bargaining platform that was circulated by the leaders of the University of Michigan graduate student union. I don’t want to go into too much detail on my opinion of my fellow doctoral students, but I’d like to highlight how out of touch with reality these bargaining demands are in light of the current Michigan labor market:

  • Full child-care subsidy.
  • 3%, 3%, and 6% year-on-year wage increases for 2010, 2011, 2012.
  • No cap on mental health care visits.
  • Two pairs of glasses per year.
  • Prevent student instructors from being removed for lack of English language proficiency.
  • 401K with employer matching.

In case you didn’t know, graduate student instructors and research assistants (myself included) already get the following compensation:

  • Full tuition waivers, which are worth between $20K (in-state) to $40K (out-of-state) after-tax per year.
  • Monthly stipends ranging from $1000 to $2000 per month, some of which are tax-free.
  • Healthcare benefits that exceed average private sector benefits.
  • Access to a wide range of other University services.

That’s right, the demands above are in addition to this compensation that we already receive.

Go ahead and read the document itself below.  Make sure to soak these demands in while looking at the unemployment rate and per-capita income for Michigan.

GEO_UM_2010

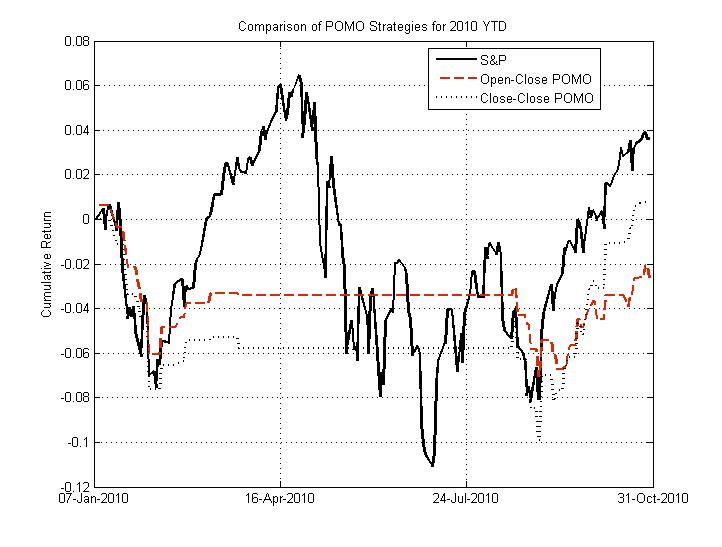
Since I’m sick of hearing ZeroHege purposefully misstating the empirical relationship between POMO and the equity market, I decided to put up this little figure below. This figure demonstrates the performance of the S&P 500 (SPY) in solid black compared to two POMO strategies in dashed black and red (close-close and open-close, respectively).

Note that only holding the market on POMO days has not returned more than the buy-and-hold S&P 500 strategy year-to-date. The S&P 500 has returned 3.62% YTD (close-close, not including dividend, which puts the buy-hold strategy even further ahead), whereas the open-close and close-close strategies have returned -2.63 and 0.79% respectively. These strategies do not even outperform the S&P 500 on a risk-adjusted basis (Sharpe). Furthermore, none of the regressions that were significant (p=0.05) in the 2005-2010 dataset are significant (p=0.1) in the 10 months through this year. In other words, though a relationship between the accepted-submitted proportion and return magnitude exists in the dataset as a whole, this relationship appears to have disappeared on the daily timescale.  Sorry, Tyler(s).