What would happen if you took the Index and Sector Summary Heatmap I made last week, blew it up to the size of a 36MP image (6000-by-6000), and then added a plot of the change in correlation over time. Great question! Look below.

Since there’s a lot going on here, let’s summarize what’s going on:

  • Make sure you zoom into the figure!  You can use the scroll wheel on your mouse or two-finger slide on your touchpad to quickly zoom in and out.
  • Each diagonal cell shows the return of each asset over the past week (6 periods, 5 returns). As an asset increases, the line is colored green, and as an asset decreases, the line is colored red.
  • The lower left hand corner of each diagonal cell  shows the total return of the asset over the past week.  There’s also a label down there, in case you’re zoomed in and can’t see the labels on the edge.
  • The off-diagonal cells show the correlation (5-period return) between two assets.  The color of the cell indicates the degree of correlation – more correlated assets are more green, and less correlated assets are more red.  In case you’re zoomed in, there’s a label in the lower left hand corner that tells you which two assets you’re looking at.
  • The off-diagonal cells also show the time series of 5-day return correlation over the past 4 weeks.

I’ve always toyed with the idea of buying one of the Grant’s Interest Rate Observer cartoons.  The latest issue is out and here’s the new cartoon:

You can see the full archive of cartoons here.

I posted a script along with the Permanent Open Market Operation dataset that was designed to process the POMO XML data from the NYFRB historical data interface.  However, this script required you to have already downloaded the data and put it in the proper location.

I’ve updated the script so that the most recent data is automatically retrieved directly from the NYFRB interface.  You can get the code below:

Headline just hit the wire before 4:15pm:
“NYSE: Close In 58 ‘Symbols’ Delayed Following Hardware Recovery”

Remember those $500M cancelled transaction on SPY two weeks ago and the NYSE explanation? Get ready for another one.

First, some context – since ZH is the site that most frequently discusses POMO, I have been posting some of my work there in the comment sections pretty regularly. There’s typically quite a bit of “high quality click-through,” especially from some well-known firms in NYC and London. This morning, I posted a comment on my research from this morning on how the ZH’s Submitted/Accepted ratio post yesterday was not totally true on one of the usual ZH POMO posts. In under 30 seconds, it was deleted, and soon after the following email conversation began.  Here are my two cents:

  • When did ZH get serious about monetizing itself via ad revenue?  Is there any talk of going public or is anyone interesting in forming a coalition to LBO them?!
  • Since when should the null hypothesis be “conspiracy theory = true” ?  Or did Tyler miss STATS100?

Tyler, 9:17am:We appreciate constructive and critical thought. If you would like to buy advertising space, however, to promote your blog, please advise

Me, 9:18am: How do I copy-paste the 1000 words necessary to properly respond into the comment section?

Tyler, 9:21am: I believe blasting every even remotely POMO related post with linkbacks is sufficient. Looking at a history of your comments for the past week shows behavior that some would characterize as self-promoting spam, which by the way is forbidden on zero hedge

Me, 9:25am: I won’t deny that it’s definitely strategic and will stop if it’s really a problem. You let plenty of crazier shit through, which only provides fodder for people who don’t want to believe you’re a credible source of information. I figured that the appearance of some reasonable and rigorous discussion in the comments would make both of us better off.

Tyler, 9:29am: By all means: however for you to post something with a headline that says “zero hedge is wrong” and to have a conclusion “the dollar volume and magnitude of the change are statistically significantly related to the POMO accepted-to-submitted ratio, but the direction is not really guaranteed” seems a little self defeating and itself is somewhat statistically suspect. Did you actually refute the null hypothesis?
As for people who don’t want to believe about ZH being a credible source of information, we really couldn’t give a rat’s ass, and wish them safe travels elsewhere.

Me, 9:33am: You mean I used a headline that was somewhat hyperbolic? Fair point but probably the pot calling the kettle black. As far as the data and numbers, I put all my data and code online, so anybody can download it and run it on their own.
Anyway, regardless of this tiff, thanks for what you do. The world is probably a better place for the site, not just in a feel-good bullshit kind of way.

N.B.: This seems like pretty clear fair use of these emails.  If anyone thinks differently (e.g., Tyler(s)), feel free to let me know before calling your lawyer.

It seems like many of my posts lately have been critical of others lately (#1: POMO, #2: Dollar / Gold, #3: Twitter ).  On the downside, everybody wants to get along and nobody makes friends on the attack.  On the upside, it’s good for plenty of site hits and provides two sides to a discussion.

So what the hell, here it goes – here’s why I think the ZeroHedge submitted/accepted ratio post gets it wrong. (Note that all of the analysis, both here and by John Lohman, suffers from an in-sample issue.  None of this is really a strategy that could be implemented without information about the submitted-to-accepted ratio in advance.  This may still be profitable if you took the positions at 11am instead of 9:30am, but none of the data we’re providing proves it.  I will be performing real intraday analysis with out-of-sample backtesting in the  paper I’m working on right now).

First of all, I think John Lohman’s logic is mostly right in the hypothesis.  If the “conspiracy theory” is really true, then the ratio of submitted-to-accepted should be proportional to the market’s return.  However, there are a few points I’d like to make for rigor’s sake here.

  • First, why can’t PDs go short too?  Maybe it makes more sense to put the absolute value of the market’s return on the LHS, dropping the sign. (Hint: See below if you want the answer!)
  • Second, there are a number of alternate hypotheses that are not conspiracy-like that could also result in this proportional relationship.  Maybe market participants just take some days of the week off, and the Fed chose to schedule POMO on days that would have higher liquidity anyway.  If you were Brian Sack, wouldn’t you want to schedule these operations on days where the most PDs would participate or they would be best staffed?
  • Third, just to emphasize it again, neither John nor I are actually presenting these analyses as something you can take to the market.  The submitted-accepted ratio comes out after the operation begins, which is never before 9:30am, which means you could never realize the returns we’re showing precisely.  For a strategy you can actually execute, see yesterday’s post (but don’t assume it’s profitably stable).
  • Fourth, I’ve switched from submitted-to-accepted to accepted-to-submitted.  This makes everything easier to see and interpret.

OK, so again, John’s logic is decent enough.  If I had to guess, Tyler at ZH likely added his own emphasis to the post “for effect,” which might have masked some of John’s real tone.  So down to the brass tacks and the data.  First of all, I’m using the SPY for the S&P 500 and my POMO dataset for information on the submitted-to-accepted ratio.  I’m also publishing the Matlab code here, just for full disclosure sake.

Now, if you run this code, you’ll see the following two scatter plots pop up.  The red are the bottom third of the POMO operations by accepted-to-submitted ratio, the blue are the middle third, and the green are the top third.
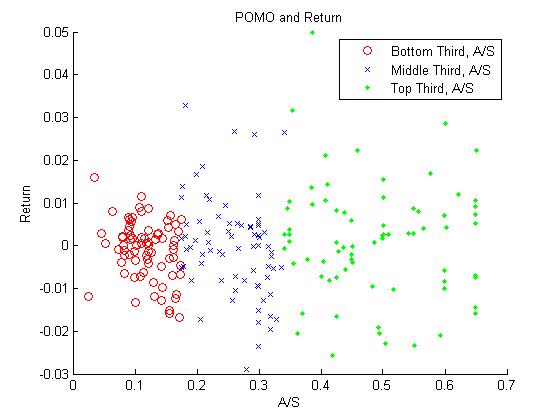
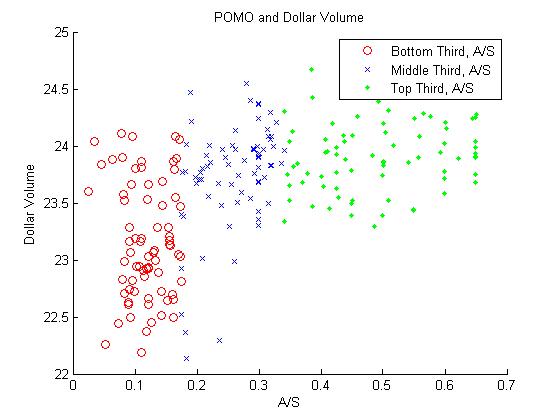
OK, so it looks like there’s definitely something going on for the dollar volume.  However, the story for the return is a little bit more fuzzy.  It appears that the spread increases as the accepted-to-submitted ratio increases, but not necessarily that there is a strong direction to the sign.  Maybe, as I mentioned above, the magnitude of the return is what’s  proportional, not just the value.  As you can see in the Matlab code, I fit a simple GLM for each of these and get the following:

  • log(close) – log(open) ~ accepted/submitted ratio: The coefficient on the ratio is slightly positive (0.0066, +-0.0047) but the t-stat is 1.4.  No go.
  • log(dollar volume) ~ accepted/submitted ratio: The coefficient is on the ratio is definitely positive (1.75, +-0.18) and the t-stat is 9.6.  This conclusion is definitely supported – the ratio of accepted-to-submitted is proportional to the total dollars traded on SPY.
  • abs(log(close) – log(open)) ~ accepted/submitted ratio: In this case, the coefficient is definitely positive (0.0159, +-0.0032) and the t-stat 5.0.  This conclusion is also supported – the ratio of accepted-to-submitted is proportional to the magnitude of SPY’s return, but not necessarily the direction.

So there you have it – the dollar volume and magnitude of the change are statistically significantly related to the POMO accepted-to-submitted ratio, but the direction is not really guaranteed.  Much more of this to come in a research paper I’m currently working on.

I noticed that there’s been some analysis of the performance of the market on days with and without POMO from Pragmatic Capitalism.  I’ve been running some preliminary calculations for a short research paper on the topic and noticed that my numbers didn’t match up.  I’ve decided to publish some of these results.

First of all, I’m using the dataset that I published yesterday on all Permanent Open Market Operations.  There have now been 230 POMO operations, including both Treasury and agency transactions and purchases and sales.  I’m also using the performance of SPY from August 2005 to October 25th, 2010.

Furthermore, my numbers diverge from the Pragmatic Capitalism on returns.  Returns are a bit of a fuzzy concept, however, so I’ve tried quite a few options.

Option 1: Log(close) – Log(open) on the day of POMO.  In this case, POMO returns 13.9% with a daily std. dev. of 1.18%, whereas no POMO returns -34.7% and a daily std. dev. of 1.26%.  52.68% of POMO intraday returns are positive, whereas 51.49% of no POMO returns are positive.

Option 2: Log(tomorrow close) – Log(close).  In other words, buy at the end of a POMO day and market-on-close tomorrow.  In this case, POMO returns 8.30% with a daily std. dev. of 1.46%, whereas no POMO returns -11.4% with a daily std. dev. of 1.56%.

Option 3: Log(close) – Log(yesterday close).  This means buy market-on-close the day before POMO and sell market-on-close the day of POMO.  This strategy returns 29.5% with a daily std. dev. of 0.57%.  The alternative returns -32.7% with a daily std. dev. of 1.44%.  Clearly frontrunning POMO on SPY is profitable, but we should all be clear about what we’re calculating when we talk about strategies here.

N.B.: As I mentioned, this will be part of a short research paper in the next week or so.  I’ll address whether or not these returns are stable, especially in the past few weeks, in the paper.

I’m glad the FT Alphaville team is on GMT, because it makes waking up in EST so much more entertaining. Read this morning’s article on the NZDUSD bounce, or, as it’s been dubbed, the “Hobbit bounce.”