Interesting paper released by R. Wepachowski from Markit, well-known for their credit risk indices.

Abstract:The Libor Market Model describes the evolution of a discrete subset of all interest rates quoted in the market. Generation of the complete yield curve from a simulated set of rates (the so-called “Libor rate interpolation”) is one of the basic challenges which are faced by a practical user of LMM. Incorrect implementation can lead to arbitrage in the model and render generated prices invalid. In this paper, we present a rate interpolation scheme which not only is arbitrage-free, but also generates a natural-looking, smooth term structure of interpolated rates’ volatilities. It is conceptually simple and computationally efficient.

R. Werpachowski. Arbitrage-Free Rate Interpolation Scheme for Libor Market Model with Smooth Volatility Term Structure. http://ssrn.com/abstract=1729828

I saw that this paper on SSRN, High Frequency Trading and its Impact on Market Quality, was updated a week or so ago (courtesy of Alea) and I thought it would be worth posting.   The abstract of the paper below:

This paper examines the impact of high frequency trading (HFT) on the U.S. equities market. I analyze a unique dataset to study the strategies utilized by high frequency traders (HFTs), their profitability, and their relationship with characteristics of the overall market, including liquidity, price discovery, and volatility. The 26 high frequency trading firms in the dataset participate in 73.7\% of all trades. I find the following key results: (1) HFTs tend to follow a price reversal strategy driven by order imbalances, (2) HFTs earn gross trading profits of approximately \$2.8 billion annually, (3) HFTs do not seem to systematically engage in a non-HFTr anticipatory trading strategy, (4) HFTs’ strategies are more correlated with each other than are non-HFTs’, (5) HFTs’ trading level changes only moderately as volatility increases, (6) HFTs add substantially to the price discovery process, (7) HFTs provide the best bid and offer quotes for a significant portion of the trading day and do so strategically so as to avoid informed traders, but provide only one-fourth of the book depth as do non-HFTs, and (8) HFTs may dampen intraday volatility. These findings suggest that HFTs’ activities are not detrimental to non-HFTs and that HFT tends to improve market quality.

J. Brogaard. High Frequency Trading and its Impact on Market Quality. Available at SSRN.

My gut instinct is that there are a few issues with the paper:

  • As Jonathan acknowledges, he does not address order book dynamics or, more importantly, other identified malicious HFT practices (e.g., stuffing).  Since this is a job paper and therefore has to be approachable and “bite-sized,” this in itself is fine.  However, the normative claim that “HFTs are not bad” may be too strong in the absence of this analysis.
  • Without a better idea of where HFTs trade, it is hard to extrapolate from the sample of 120 stocks.  The exact selection method is not explicit in the paper, but it seems that the stocks were chosen from the NASDAQ to include a range of market caps.  Without a better idea of where HFTs trade, it is quite possible that this selection undersamples the stocks that most HFT transactions occur on.  In the absence of industry-wide data, this is a necessary research choice, but its limiting nature on the conclusions should be better stated.
  • On a somewhat related note, the estimation of profitability and risk-adjusted return is quite daring given the above two constraints.

Despite these few notes, the paper should definitely get Jonathan a great job and I’m interested to see more work on his dataset.  He’s also got a great advisor, Thomas Brennan, who I met at the Midwest Law & Economics Conference.  Thomas has more industry experience than 90% of all academics and his papers also make for great reads (some on SSRN, most in law reviews or finance journals).

It seems like many of my posts lately have been critical of others lately (#1: POMO, #2: Dollar / Gold, #3: Twitter ).  On the downside, everybody wants to get along and nobody makes friends on the attack.  On the upside, it’s good for plenty of site hits and provides two sides to a discussion.

So what the hell, here it goes – here’s why I think the ZeroHedge submitted/accepted ratio post gets it wrong. (Note that all of the analysis, both here and by John Lohman, suffers from an in-sample issue.  None of this is really a strategy that could be implemented without information about the submitted-to-accepted ratio in advance.  This may still be profitable if you took the positions at 11am instead of 9:30am, but none of the data we’re providing proves it.  I will be performing real intraday analysis with out-of-sample backtesting in the  paper I’m working on right now).

First of all, I think John Lohman’s logic is mostly right in the hypothesis.  If the “conspiracy theory” is really true, then the ratio of submitted-to-accepted should be proportional to the market’s return.  However, there are a few points I’d like to make for rigor’s sake here.

  • First, why can’t PDs go short too?  Maybe it makes more sense to put the absolute value of the market’s return on the LHS, dropping the sign. (Hint: See below if you want the answer!)
  • Second, there are a number of alternate hypotheses that are not conspiracy-like that could also result in this proportional relationship.  Maybe market participants just take some days of the week off, and the Fed chose to schedule POMO on days that would have higher liquidity anyway.  If you were Brian Sack, wouldn’t you want to schedule these operations on days where the most PDs would participate or they would be best staffed?
  • Third, just to emphasize it again, neither John nor I are actually presenting these analyses as something you can take to the market.  The submitted-accepted ratio comes out after the operation begins, which is never before 9:30am, which means you could never realize the returns we’re showing precisely.  For a strategy you can actually execute, see yesterday’s post (but don’t assume it’s profitably stable).
  • Fourth, I’ve switched from submitted-to-accepted to accepted-to-submitted.  This makes everything easier to see and interpret.

OK, so again, John’s logic is decent enough.  If I had to guess, Tyler at ZH likely added his own emphasis to the post “for effect,” which might have masked some of John’s real tone.  So down to the brass tacks and the data.  First of all, I’m using the SPY for the S&P 500 and my POMO dataset for information on the submitted-to-accepted ratio.  I’m also publishing the Matlab code here, just for full disclosure sake.

Now, if you run this code, you’ll see the following two scatter plots pop up.  The red are the bottom third of the POMO operations by accepted-to-submitted ratio, the blue are the middle third, and the green are the top third.
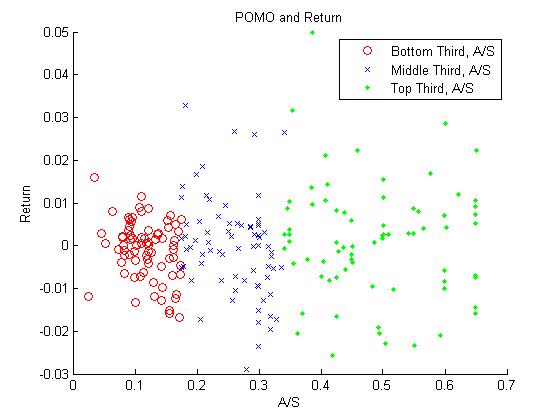
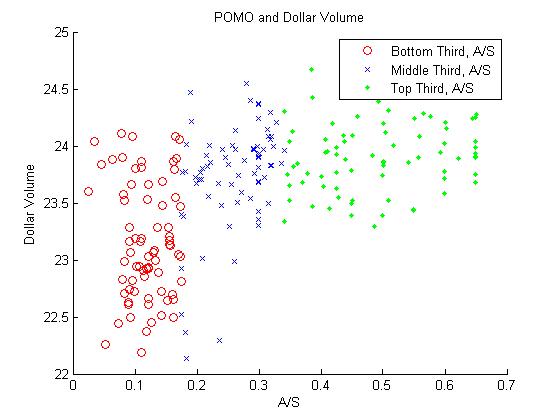
OK, so it looks like there’s definitely something going on for the dollar volume.  However, the story for the return is a little bit more fuzzy.  It appears that the spread increases as the accepted-to-submitted ratio increases, but not necessarily that there is a strong direction to the sign.  Maybe, as I mentioned above, the magnitude of the return is what’s  proportional, not just the value.  As you can see in the Matlab code, I fit a simple GLM for each of these and get the following:

  • log(close) – log(open) ~ accepted/submitted ratio: The coefficient on the ratio is slightly positive (0.0066, +-0.0047) but the t-stat is 1.4.  No go.
  • log(dollar volume) ~ accepted/submitted ratio: The coefficient is on the ratio is definitely positive (1.75, +-0.18) and the t-stat is 9.6.  This conclusion is definitely supported – the ratio of accepted-to-submitted is proportional to the total dollars traded on SPY.
  • abs(log(close) – log(open)) ~ accepted/submitted ratio: In this case, the coefficient is definitely positive (0.0159, +-0.0032) and the t-stat 5.0.  This conclusion is also supported – the ratio of accepted-to-submitted is proportional to the magnitude of SPY’s return, but not necessarily the direction.

So there you have it – the dollar volume and magnitude of the change are statistically significantly related to the POMO accepted-to-submitted ratio, but the direction is not really guaranteed.  Much more of this to come in a research paper I’m currently working on.

Despite the recent decline in front and future VIX prices, many traders have recently taken speculative positions on increasing price ranges.  I decided to highlight the ten exchange-traded assets that had the widest weekly ranges as a proportion of Friday's closing price.  In addition to presenting just the range, I'm also providing the week's return, total dollar volume, and correlation to the S&P and gold.


Symbol Return Range Dollar Volume ($M) SPY Correlation GLD Correlation
TMF -11.1% 15.3% 28.461793 94.3% 66.0%
TYP -11.2% 15.1% 59.262521 -41.9% 55.7%
ZSL -10.5% 14.7% 64.935627 -5.7% -93.7%
SQQQ -10.6% 14.5% 163.841642 -39.0% 59.1%
CZM 7.9% 13.3% 25.011599 69.7% 91.9%
CZI -7.7% 13.2% 2.204423 -77.5% -82.7%
TMV 11.0% 13.2% 103.653646 -95.4% -63.2%
FAS -5.5% 12.8% 4001.066165 64.8% 28.1%
TYH 10.6% 12.7% 144.928741 43.9% -56.6%
TZA -4.4% 12.6% 2530.503744 -77.6% -87.2%


The results shouldn't be too surprising.  The pack is led by leveraged funds that track technology, Treasury, and commodities.  TYP, TYH, and SQQQ all correspond to triple-leverage Nasdaq or broad tech funds; of these, TYH and SQQQ were much more heavily traded this week.  Treasury funds hold their own as well, with the triple 20-year (TMF) and the triple short 30-year (TMV) showing large ranges this week.   ZSL is a double-leverage short silver fund, and CZM/CZI are triple-leveraged long/short China funds; much of the move in both Chinese and commodity markets this week was driven by the dollar.  Of all these funds, the triple-leverage financial ETF (FAS) clearly saw the most trading action, churning more than $4B this week.  With plenty of housing, job, and industrial data out next week, look for these funds to continue to expand on their recent price ranges.  

“Faith-based” investing, a close cousin of “socially responsible” investing, has received an increasing amount of attention over the past decade.  Though both of these trends have been adversely affected by the recent downturn, I thought we’d check in to see how the family of funds issued by FaithShares Advisors, LLC has fared year-to-date.  FaithShares offers funds for five “different” faiths – Catholic, Lutheran, Methodist, Christian, and Baptist values.

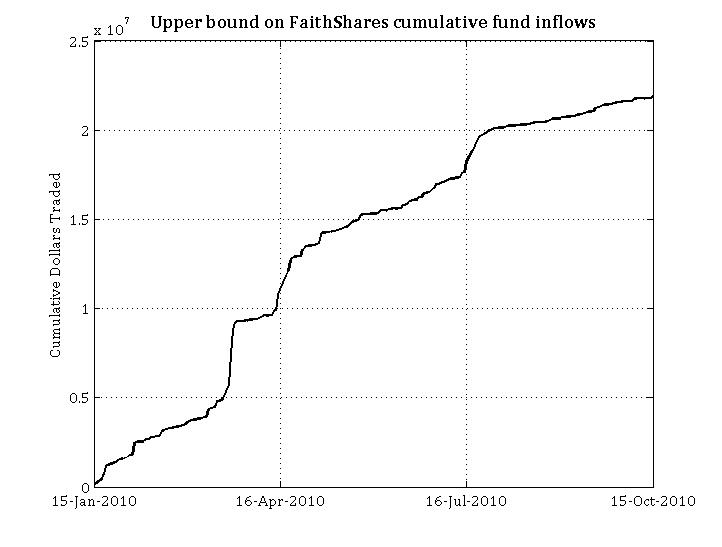
The first figure belows shows the upper bound on fund inflows since January 15th.  The upper bound logic is based on the following two tricks.  First, I’ve calculated dollars traded based on each day’s price high.  Second, if you assume that every share traded represents an inflow and not an outflow, then the number of dollars traded represents the maximum possible inflow.  The first figure below shows that this upper bound is just under $22 million dollars.

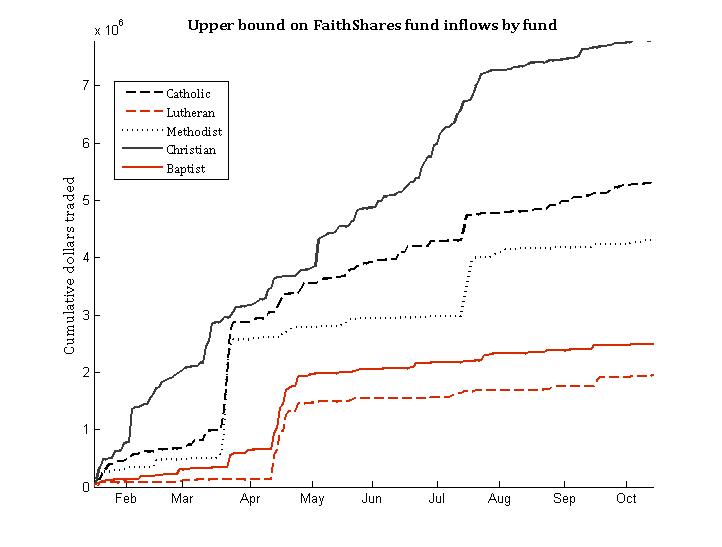
The second figure shows this upper bound on inflows by each faith.  The broad, Christian based fund appears to have attracted the most interest with an upper bound of $7.78M.  The Catholic and Methodist funds follow far behind with upper bounds of $5.35M and $4.30M respectively.  The Baptist and Lutheran funds round out the pack with a respective $2.49M and $1.96M.

To put this into perspective, more dollars are usually traded in SPY in the first 10 seconds after 9:30AM.  If you’re interested in more of the details on the internal management of these funds and FaithShares Advisors, LLC, please refer to their last Certified Shareholder Report on EDGAR.

I’ve just released a new revision of my working paper, Intraday Correlation Patterns Between the S&P 500 and Sector Indices, which you can download by clicking the link.  Here are a few of the improvements in the new revision:

  • I’ve updated the paper to include minutely data from August 23rd to October 1st.  This has effectively doubled the size of the dataset.  Furthermore, the sample now includes both up and down weeks.
  • I’ve added two-sample K-S and Wilcoxon rank-sum tests to show more rigorously that the patterns observed in return and volume correlation are significant at the \alpha=0.001 level.
  • The paper now includes many more references to relevant existing literature.  If you think I’ve missed a paper that should be included, please let me know!

You can cite the paper in its current form as:

Bommarito, Michael James, Intraday Correlation Patterns between the S&P 500 and Sector Indices (September 16, 2010). Available at SSRN: http://ssrn.com/abstract=1677915

Kristina Peterson’s article in the WSJ last week on intraday patterns got me thinking and the result is this brief research paper.  There’s a significant amount of work I’d like to put into the paper, especially the preliminary analysis on volume correlation, but the results are interesting enough that I decided to publish a draft.  You can read the abstract below and download the paper here.

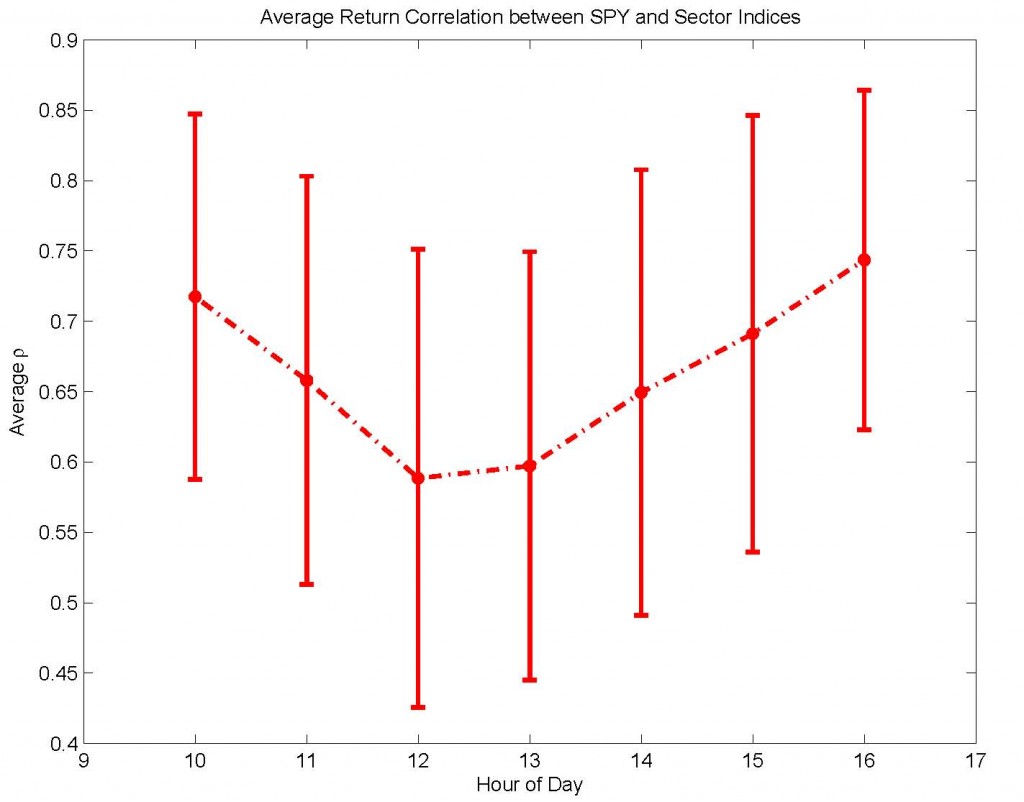
In this brief research note, I explore recent patterns in intraday return and volume correlation between the S\&P 500 and sector indices, as represented by minutely data from Aug. 23 to Sep. 10 for the SPDR exchange-traded funds. Notably, there appears to be evidence of two previously unreported patterns in intraday correlation. First, there is a “U-shaped” trend in return correlation, characterized by higher correlation at open and close and lower correlation during mid-day hours. Second, volume correlation is marked by lower values in the morning and increasing values in the afternoon. In some cases, this trend even takes the infamous “hockey-stick” shape, exhibiting stable values in the morning but sharply increasing values in the late afternoon. To ensure that these patterns are not a function of the choice of correlation window size, I confirm that these patterns are qualitatively stable over correlation windows ranging from 10 minutes to 90 minutes. These findings indicate that non-time-stationary patterns exist not only for volume and volatility, as previously reported, but also for the correlation of return and volume between the market and sector indices. These results have possible implications for intraday market efficiency and for trading strategies that rely on intraday time-stationarity of return or volume correlation.

Bommarito, Michael James, Intraday Correlation Patterns between the S&P 500 and Sector Indices (September 16, 2010). Available at SSRN: http://papers.ssrn.com/sol3/papers.cfm?abstract_id=1677915

This post was originally published on February 3rd, 2008. It has been slightly modified from a previous version of the site.

As volatility has increased over the past months, the ProShares Ultra ETFs have seen a dramatic increase in average dollar liquidity.  There are exactly 50 of these leveraged instruments at the moment, and they are listed below, sorted by age.

ETF Age (sessions)
ProShares Ultra Dow30 407
ProShares Ultra MidCap400 407
ProShares Ultra S&P500 407
ProShares Ultra QQQ 406
ProShares UltraShort Dow30 392
ProShares UltraShort MidCap400 392
ProShares UltraShort QQQ 392
ProShares UltraShort S&P500 392
ProShares Ultra SmallCap600 258
ProShares UltraShort SmallCap600 258
ProShares UltraShort Russell2000 258
ProShares Ultra Russell2000 258
ProShares Ultra Oil & Gas 253
ProShares UltraShort Oil & Gas 253
ProShares Ultra Technology 253
ProShares UltraShort Health Care 253
ProShares Ultra Health Care 253
ProShares UltraShort Industrials 253
ProShares UltraShort Financials 253
ProShares UltraShort Real Estate 253
ProShares UltraShort Semiconductors 253
ProShares UltraShort Consumer Goods 253
ProShares Ultra Consumer Goods 253
ProShares Ultra Utilities 253
ProShares Ultra Semiconductors 253
ProShares Ultra Financials 253
ProShares UltraShort Technology 252
ProShares UltraShort Consumer Services 252
ProShares UltraShort Basic Materials 252
ProShares Ultra Consumer Services 252
ProShares Ultra Real Estate 252
ProShares Ultra Industrials 252
ProShares Ultra Russell1000 Growth 239
ProShares Ultra Russell2000 Growth 239
ProShares Ultra Russell MidCap Growth 239
ProShares UltraShort Utilities 225
ProShares UltraShort Russell1000 Value 208
ProShares UltraShort Russell MidCap Growth 201
ProShares UltraShort Russell2000 Value 201
ProShares UltraShort Russell MidCap Value 201
ProShares UltraShort Russell2000 Growth 201
ProShares Ultra Russell1000 Value 201
ProShares Ultra Russell2000 Value 201
ProShares Ultra Russell MidCap Value 201
ProShares Ultra Basic Materials 201
ProShares UltraShort Russell1000 Growth 198
ProShares UltraShort MSCI EAFE 68
ProShares UltraShort MSCI Emerging Market 63
ProShares UltraShort MSCI Japan 58
ProShares UltraShort FTSE/Xinhua China 58

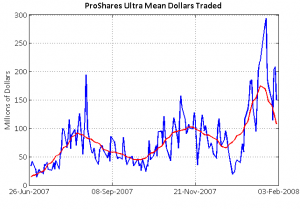
I’ve taken the product of the close and the volume for the 46 funds that have traded at least 150 sessions and averaged their daily cross-section.  The following is a chart of this average dollar liquidity over the past  150 sessions in blue, with a 20-session moving average in red.  The trend quite clearly indicates that not all market volatility is bad for ETFs.